Tuesday, October 31, 2006

Intuition, Risk Taking and Trading

One of my ongoing battles in the game of trading has been fighting my propensity for risk taking. I've used a variety of measures to combat this bad habit, one of which is actually allowing myself to take a risk every once in a while, as long as I use proper steps to manage that risk. For example, setting a tight stop and entering with a small position size. However, I've always wondered if this is a bad idea. Afterall, those with chemical dependencies are supposed to go cold turkey. Is allowing myself to "feed my habit" every once in a while going to lead me down a road I don't want to go on?

I posed this question to the esteemed trading psychologist, Brett Steenbarger. He sheds some great insights that have already helped me restructure my plan to fight risk taking. Here is his response:


You're asking a great question. There are traders (often who have
attention-deficit related problems) who seem to be attracted more to the action
of trading than to the making of money. They approach trading like gambling and
have difficulty tolerating periods in which they're not trading. I have
uniformly found that this *need* to trade and take risks is never truly filled.
Eventually the trader habituates to one level of risk taking and has to go still
higher to get that thrill. The result, invariably, is a blow up.

This is very different from the scenario in which a systematic, rule-based trader
decides to follow an intuitive hunch and place trades outside the rules. Those
intuitive hunches may represent a pattern recognition that results from long
hours of seeing and internalizing markets. I think those kinds of trades are
fine, as long as they're properly sized and as long as you keep score on them to
determine whether or not your intuition really is based on something driving
supply and demand.

In general, I think it's important to have outlets for one's needs that are outside of trading. If you have social needs, it's important to have separate outlets for those so that they don't interfere with trading. Similarly, if there are needs for risk and excitement, it makes sense to get those fulfilled outside of trading so that you can better focus on your discipline when you're in the markets. Unfulfilled needs often drive our behavior, and I'm not sure "cold turkey" is a practical solution. That's very
different from making the occasional intuitive trade when an idea just feels
right.

Brett N. Steenbarger,
Ph.D.


Now that I think about it, I wouldn't characterize my "risks" as "falling off the wagon" type risks. They are usually based on intuition gleaned through experience with the markets, which would seem to be perfectly healthy as long as proper risk measures are taken. Thus, no need to change my trading plan. What a relief. Thanks for the advice doc!

Monday, October 30, 2006

BDC Chart and a Few Clips (Hagler, Hearns, Bush)

BDC (Beldon CDT Inc.) broke down below price and moving average support on heavy volume. While this is a beautiful short setup, I wouldn't take a short position unless we get a pullback towards resistance. The oversold condition needs to be worked off a bit in order to create a favorable risk/reward.


Off Topics:

The most intense nine minutes in boxing history, Halger vs Hearns:


Bush at His Best:

CSX Chart and Trades: COST and BRCM

I sold 500 shares of COST on Friday at $53.35 (entry at $51.85) for a $750 gain (2.9% gain).

I got stopped out of my BRCM short at $29.25 (short at $27.60) today for an $825 loss (5.5 percent loss) .

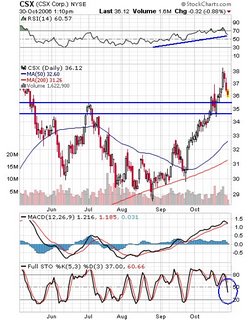
Railroads have been on fire of late and are just now starting to pullback. CSX (CSX Corp.) is no exception. The stock is finally starting to pullback, has a strong uptrending RSI reading and its stochastics are headed towards oversold territory. I'd enter on a bounce from the $35-36 support level, especially if the stock becomes oversold.


Sunday, October 29, 2006

Monday's Watchlist: csx, abv, elx, cnw, eth, ksu, sfnt, trn, vdsi

Here are five bullish and five bearish stocks from my watchlist. All of these stocks came from my weekly review of best and worst performing sectors. Charts and sector review courtesy of prophet.net

Note: For some reason these charts are doing a number on my site, so I had to remove them. They can be viewed at stockcharts.com.

The stocks include: csx abv elx cnw eth ksu sfnt trn vdsi

Friday, October 27, 2006

How I Know a Top is Forming: An Office Conversation and a Perma-Bull

{Those visiting this site via Brett Steenbarger, The Kirk Report or another link, please check out the rest of my site by clicking on "The Market Speculator" link here or above. Thanks for visiting!}

I've had my suspicions that a top is forming for quite some time, and now I am sure of it. This ain't the beginning of a bull run, it's the end (at least for the short term). Here's my evidence.

I'm sitting at my desk minding my own business, when one of my co-workers, Jane, who is very cautious with her money, stops by to chat:

Jane: You invest in stocks don't you?
Me: No, I trade stocks, I dont' invest.
Jane: What's the difference?
Me: Well, I generally hold stocks short term, from 2 days to a
few months.

Jane: So you basically gamble?
Me: No, I use technical analysis, which
gives me an "edge". I also use sound money management and focus on position
sizing and risk.

Jane: Um, well, anyway, I'm taking a big chunk money out of
retirement since the Dow is making record highs.


At this point, I almost warned her about market breadth, volume, Dow Theory, the lagging transports and sentiment readings. However, since the conversation was off to such a poor start, and I generally try to tone down the geek factor at work, I decided to just tell her to be careful and do some research first. We then had a deep conversation about this week's Lost episode (which, by the way, was awesome).

The significance of this is, it's my first "personal real world clue" that we are near a top. When conservative Jane is ready to cash in her retirement savings and poor it into the market, you know the good times are about to end. Remember, this does not mean it's time to go all-in short, since tops take time to form. However, it is a sign that we need to temper our bullishness and be prepared for a fall. I'll have my short watchlists ready!

Speaking of shorts, Tim Knight's blog is a fun read. Known to the blogging world as a "perma-bear", Tim carries his emotions on his sleeves and in his blog. Tim seems to be getting more and more frustrated with this bull market, and has started putting on some long positions. Could this be another sign that a top is forming? Afterall, tops don't form until the last of the bears give up and go with the "if you can't beat em, join em" philosophy.

Thursday, October 26, 2006

Today's Trade: CMED

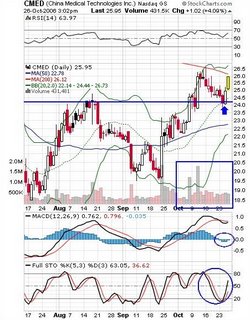
I bought 700 shares CMED (China Medical Technoligies, Inc.) today at $25.15. The stock has alot of things going for it techinically. It broke out on strong volume over resistance, followed by a low volume pullback that bottomed with a bullish engulfing pattern. This is one of my favorite long setups. Also on the bullside, the stochastics are not yet oversold and MACD look like it's about to cross the zero level.

Note that I went with a slightly larger position size than normal (my standard is 500 shares). Just as I lower position size when I feel I am taking a risk, I go a little bigger when I feel really confident.

Wednesday, October 25, 2006

Top Sectors and Oil & Steel Watchlist

Many of my long candidates come from the top performing sectors over a given time period. It's no surprise that oil and steel stocks are on this list, as they have been on fire of late. Here are the top eight sectors over the past 20 days, via prophet.net.

1. Toys & Games
2. Metals Fabrication
3. Copper
4. Steel $ Iron
5. Gold
6. Silver
7. Long Distance Carriers
8. Independent Oil & Gas

Here are some oil and steel stocks that have made their ways to my watchlist (COG, NBL, OXY, XTO, VLO, HOC, HES, PCZ, OS, CMC, RIO). Many of these stocks are coming up to resistance points, so while I've gone into bull mode, I will be somewhat cautious until the stocks push past resistance points. I'm waiting to either buy on breakouts over resistance or on pullbacks.

Oil, Steel and the Running of the Bulls


As many of you know, I've been an oil bear the past few months, and it's worked out quite nice. Well, at least in the very short term, I'm putting on the horns. There's no allegiance in this game, and I'm now an oil bull, at least until they break down.

My mind tells me I should be worried about the upcoming elections, but who am I to argue with the charts? Stay tuned. Tonight or early tomorrow morning I'll have charts of some of my favorite oil/energy picks. I'm also turning into a steel bull, and hope to have charts of X, CHAP, STLD and MT, to name a few.

I will also update todays trades late tonight.

Tuesday, October 24, 2006

Chart Requests: QCOM, CAT, TIE, NUAN, VAR

Here are my thoughts on a few stocks requested by readers. I received a lot more requests than I expected, and couldn't get to all of them, so I went with the first five requests. Please keep in mind these are not buy or sell recommendations.

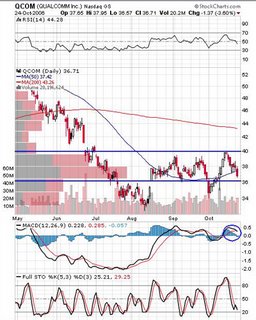
QCOM (Qualcomm, Inc):
This stock is in no man's land. I would not touch it unless it breaks one of the S/R lines on the chart. A break below $36 would be an indication to short, while a break above $40 might get me in long. The reader who made this request bought the stock at $36. If I were holding the stock, I'd place a stop at my purchase price and sell on any short term strength.


CAT (Caterpillar, Inc):

Caterpillar's breakdown makes for a good short setup. I will be watching $62 and $64. If CAT reaches these levels and fails, it's time to short. If it breaks out to the long side , it's a sign that the reaction to earnings was overdone. I'm a bit weary of shorting right now, since, over the past year, the stock has had a bullish reaction to extreme oversold levels.


TIE (Titanium Metals Corp)

This stock has been on my short watchlist for quite some time. However, there's no denying the latest breakout. Talk about a beauftul move over resistance on strong volume. I am watching this stock on the long side, and will enter if it reacts well to a pullback to $30.


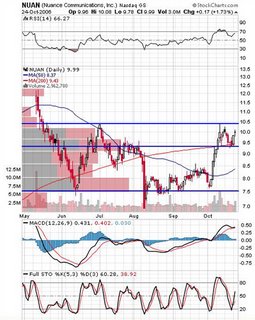
N
UAN (Nuance Communications, Inc):
Nuan's giving us some conflicting signals. RSI is not where it was when it was at the same price level in early October and MACD has been sloping down all month. However, the stock reacted well on a pullback to it's breakout point. I would wait for a "tell" before entering. If the stock breaks out over $10.50, I'm in on the long side. A nice short setup would print if NUAN breaks down below the last breakout point, around $9.40.


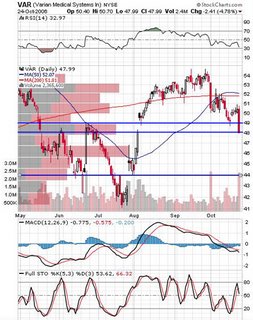
VAR (Varian Medica
l Systems, Inc):
Var looks ugly, which makes it a great short setup. There are two ways to play this one from the short side. Either enter on a break down below $48, or look for a failed bounce at $49.


Thanks to all of those who have emailed, left comments, or visited my site. I plan to make chart requests a regular feature, so feel free to request a chart.

Today's Trade, Chart Requests and TraderFeed

I went short 300 shares OII at $36.05. I'll have a chart posted tonight.

I've got some free time tonight, so anybody who would like me to analyze and annotate a chart you are watching, feel free to e-mail me at or leave the stock's symbol in the comments section.

As many of you know, Dr. Brett Steenbarger is a whiz when it comes to analzing historical performance. Check out this article looking at historic volatility.

Monday, October 23, 2006

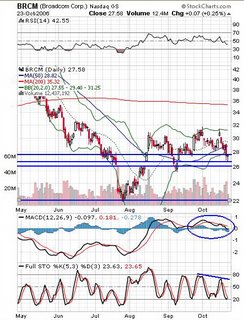
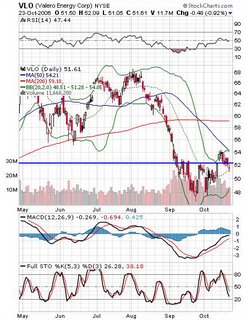
Charts of Today's Entries: BRCM, COST, VLO . . .and Ping Pong

Here are the charts that lead me to make today's entries.

BRCM (Broadcom Corp.):
I may have jumped the gun on this short, as the stochastics seem to be turning up from oversold territory and the stock printed a bullish hammer today. Maybe I got caught up in the poor earnings and weakness in the semiconductor sector. My stop is placed above the 50 day MA, so hopefully if the stock does bounce, it won't hit the stop and will then resume the downtrend.


COST (Costco Wholesale Corp.):

Beautiful short term pattern in thisstock. We have a nice breakout over resistance printing a long bar on heavy volume, a pullback to the gap that held with a nice long positive bar closing near the highs. My target is $54.


VLO (Valero Energy Corp.):

I've been waiting for a break of $52, and today we got it.


Off Topics:
I can't stop watching this clip of two insane ping pong players.


Today's Trades: AAPL, PRFT, TIE, VLO, COST and BRCM

I sold my 500 share position in AAPL at $81.71 (entry at $78.67) for a $1520 gain (+3.8%). I still feel AAPL will at least reach it's previous highs at $85, so I may re-enter on weakness.

I sold my 500 share position in PRFT at $17.45 (entry at $16.82) for a $316 gain (+3.7%).

I covered my 400 share short position in TIE at $29.20, for a measly $148 gain (+1.2%). The stock is acting better than I thought it would, and might breakout over $30.

I went short 500 shares of BRCM at $27.60. The stock spiked down on high volume on Friday, breaking a short term resistance level (see last night's chart). Bad earnings and the weak semiconductor sector makes this an attractive short.

I bought 500 shares COST at $51.85. The stock is moving up after pulling back from a breakout.

Finally, I went short 300 shares VLO at $51.85. I like the stock as a short below $52, but went with a smaller position size since oil related stocks have been tough to game lately.

I will post charts of my new entries tonight. I also hope to update the results of the porfolio.

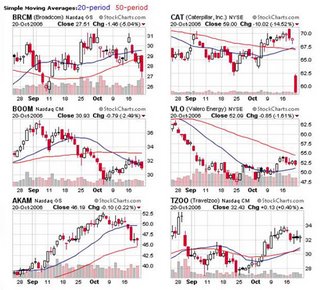
Shorts Watchlist and Some Hilarious Clips

Here are six stocks that head my shorts watchlist:
BRCM (Broadcom), CAT (Caterpillar, Inc), BOOM (Dynamic Materials Corp.), VLO (Valero Energy), AKAM (Akamai Technologies, Inc) and TZOO (Travelzoo Inc.)
.


Off Topics:
Do the Trump Dance


Ali G Pitches to Trump and Other Execs


Ali G at the United Nations
How does this guy land interviews with the likes of Boutros Boutros Gali? And Michael Jordan owns his own country?

Friday, October 20, 2006

Part-Time Trading : It Can Be Done! -- Part I

{Those visiting this site via TraderMike, TheKirkReport, or another link, please check out the rest of my site by clicking on "The Market Speculator" link here or above. Thanks for visiting!}

Regular readers of my blog, or anybody who has read my trading goals, know that I have a day job and trade around it. I am what is commonly known as a part-time trader. I received an e-mail about the topic yesterday, asking whether I'd be better off "going from part-time to full-time".

Opinions vary on whether part-time traders can be successful. Two prominent trading bloggers take opposing views. Dave Landry believes part-time trading is a good way to not "micro-manage trades", while Charles Kirk doesn't think it's likely to trade successfully on a part-time basis. Mr. Kirk wrote:

When I made a couple of trades this week (both of which turned out to be unsuccessful because I was late to the party), I'm reminded of a lesson that I tend to forget - you can't trade stocks well on a part-time basis. At least I'm not smart enough to. Perhaps you're a bit more focused than I am.


Don't let Mr. Kirk fool you . . . the dude is uber-smart. I don't go a day without reading his site. However, I have to respectully disagree with his statement. Not only do I think one can make big gains trading part-time, I believe it can be better for certain types of traders. Most notably, for swing traders who hold stocks anywhere from a few days to a few months.

My greatest battle as a swing trader has been, as Mr. Landry would say, not micro-managing my trades. While I do work full-time, I have access to a computer at almost all hours of the day, and can view streaming real time quotes. However, and some of you may think I'm crazy for this, I don't look at them. I've learned to turn off the quotes, and I'm all the better for it. In my opinion, one of the worst things a swing trader can do is watch every freakin' tick. Those little buggers can drive a swing trader crazy. I can't count the number of times I've pulled out of a trade based on the "noise" of the ticks. Of course, most of the time the ticks were just that, noise, and my trades would go exactly as I had expected when I made them. Once I shut off the streaming quotes and let my stops work for me, my trading results went parabolic.

Now I only check my watchlists and current positions at the open, one hour into the trading day, at lunch, and during the last half hour or so. There are specific reasons for each of those times. The most important quotes for my style of trading print at the open and the close. The first hour (and first half hour) point tells me if the open is for real. Finally, I find that lunch is a good time to get "bargain prices" for entry points, as the market tends to soften at this time.

What do I mean by letting my stops work for me? When I place a stop, there is a well reasoned purpose for doing so. I don't place stops by setting some arbitrary percentage. My stops are placed by taking into account support, resistance, the stock's volatility and moving averages. They are designed to allow for noise and only trigger if there is something fundamentally wrong with my trading idea. Therefore, there is absolutely no reason for me to watch every tick. All I need to do is let the stops do their job.

For a swing trader like me, trading full-time would not help, and could actually hurt my bottom line. Of course, you must know your time frame, and a daytrader would have to trade full- time. But for swing trader, part-time trading can be a great fit. Besided the methodological benefits, I also gain by building my trading account while still having another dependable stream of income. It's comforting to know that my next trade will have no effect on my ability to pay my mortgage or buy my kid's diapers. If that wasn't the case, I might need to buy some of those diapers for myself!

How do I measure the tone of the market, manage my watchlists and scan for new stocks? Surprisingly, it only takes me 1-2 hours per day (usually after my daughter falls asleep), after which I feel I know everything I need to be ready for the next day. In Part II, I'll go over my nightly routine.

I welcome questions and comments on this post. Feel free to post a comment here or send me an e-mail.

Today's Trade: PRFT

I bought 500 shares PRFT (Perficient, Inc.) at $16.82. The stock has been a nice momentum play and is consolidating after another breakout. My entry was timed the day after it printed an NR7 on the daily chart, with a stop placed just below the breakout point. If I wanted to be more aggressive with my stop placement, I could place my stop just below the NR7 bar.

Thursday, October 19, 2006

Today's Trade (AAPL) and BOOM Chart

I bought 400 shares of AAPL (Apple Computer, Inc.) at $78.67. I detailed my reasons in two posts earlier this week. I've got a mental stop placed around $77.20.

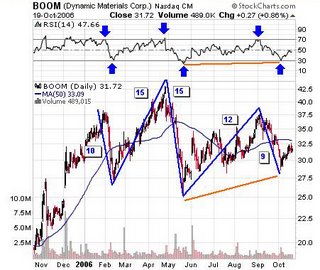
Boom(Dynamic Materials Corp.) has been an easy play over the past year. You buy at extermely oversold positions and sell short at overbought extremes. Buying at 30 RSI and selling at 70 RSI would have netted you 10, 15, 15, 12 and 9 point gains. You can bet I'll be waiting for the next extreme. Notice the small bullish divergence in the chart, marked by the orange line. My best guess is we'll see overbought extremes next.

Note that this trade only comes once every few months, and there are other shorter term opportunities in between this larger time framed trade.

Trading Quotes From Criminal Minds

One of my favorite shows on television is Criminal Minds, which I feel is the smartest show on television. The quotes alone are worth the price of admission. Here are a few that could be applied to trading. Take a read and think about how each quote relates to trading. You can learn more about each author by clicking on the name.

Emerson said, "All is riddle, and the key to a riddle is another riddle."

Faulkner once said, "Don't bother just to be better than your contemporaries or predecessors. Try to be better than yourself."

Einstein once said, "Imagination is more important than knowledge. Knowledge is limited. Imagination encircles the world."

Samuel Johnson wrote, "Almost all absurdity of conduct arises from the imitation of those who we cannot resemble."

Shakespeare wrote, "Nothing is so common as the wish to be remarkable." "When you have eliminated the impossible, whatever remains, however improbable, must be the truth."

Robert Oxton Bolton once wrote, "A belief is not merely an idea the mind possesses; it is an idea that possesses the mind."

Nietzsche wrote, "The individual has always had to struggle to keep from being overwhelmed by the tribe."

Albert Einstein said, "Whoever undertakes to set himself up as judge in the field of truth and knowledge is shipwrecked by the laughter of the gods."

"The defects and faults of the mind are like wounds in the body; after all imaginable care has been taken to heal them up, still the will be a scar left behind." French writer François de la Rochefoucauld. "

"It has been said, 'time heals all wounds.' I do not agree. The wounds remain. In time, the mind, protecting its sanity, covers them with scar tissue and the pain lessens. But it is never gone." Rose Kennedy

Philosopher Kahlil Gibran wrote "Out of suffering have emerged the strongest souls; the most massive characters are seared with scars."

Gideon (character on show): "Try again. Fail again. Fail better."

Wednesday, October 18, 2006

AAPL Entry Point

In Monday's post, I noted that a breakout over $77.50 after earnings would be a good entry point for AAPL (Apple Computer, Inc.). After today's bell, the company posted good earnings (although iPod sales weren't great) and, as I type, is trading over $78. I don't like to trade after hours, so if the stock is trading above the break out point tomorrow morning, and has not run up too far, I'll probably enter long. I wouldn't be surprised if this is the catalyst to challenge its high at $85.

Here again is Monday's chart with the breakout range marked.

Today's Trade and Chart: TIE

I went short 400 shares of TIE (Titanuim Metals Corp) at $29.57. I have placed a stop just above $30 resistance. Stochastics are extremely overbought, but have not turned over yet, so I'm in this trade earlier than normal. Also, the stock has moved up to resistance on healthy volume, adding more risk to this short. To combat the risk, I went with a smaller position size and an aggressive stop.

Tuesday, October 17, 2006

Chart: DPS

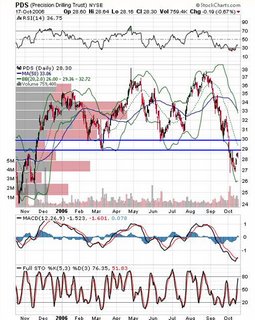
DPS (Precison Drilling Trust) is bouncing off lows towards resistance in the $29-30 range. The weakness in the stock's technicals leads me to believe this pullback will lead to another thrust down. However, I'll wait to see how it handles the resistance area before entering a short position.

Monday, October 16, 2006

Wallstrip, My Take on AAPL and Hilarious Mac Spoofs

Wallstrip, a joint blogging venture by a bunch of muy talented traders and bloggers, launched today with an excellent round table analysis of AAPL (Apple Computer, Inc.). It's definately worth viewing for the different takes on the stock.

Here is my own take on Apple. I see a healthy uptrend all sweet varieties, such as the juicy golden delicious. Tart variations, like the washington apple, concern me as they have not participated in the uptrend . . . okay, lame joke. Better stop before I do anymore damage to my credibility. Honestly, it sounded better in my head.

I can't make a prediction on the stock's direction, but it's easy to see where the breakout points are. The key numbers are $77.50 and $72.50. A break in either direction will get me in the stock, long for the former and short for the latter, as either direction looks good for at least 7 points. Both would also make for low risk trades, since a stop can be placed just above/below the breakout points. Note that RSI has formed a trading range just as the stock has. Use RSI to confirm the breakout.


And now for the funny. Here are some great spoofs on the Mac commercials, plucked from youtube.


Chart from My Watchlist: KCP

KCP (Kenneth Cole Productions) is at the top of my "longs watchlist". I'm waiting to see how it handles a pullback to $25.50, after an impressive breakout over resistance on heavy volume. RSI is in a nice uptrend with higher lows, and MACD has turned positive. There's also a chance that the 50 day MA might cross the 200 day MA in the near future.

Saturday, October 14, 2006

Short Setup #1 and 2: Falling Off the Mountain and Falling Off the Hill

{Those visiting this site via TraderMike, or another link, please check out the rest of my site by clicking on "The Market Speculator" link here or above. Thanks for visiting!}

Over the next few weeks I'm going to present a few of my favorite setups, which I've labeled in my trading journal as "money setups". The first two short setups are, what I call "Falling off the Mountain" and "Falling off the Hill". What's so great about them? In my opinion, they do a good job of combining key elements of technical analysis: candlesticks, support and resistance levels, stochastics, RSI and chart patterns. Used seperately, each element is rather weak. However, combining them can give you a powerful edge.

Short Setup #1: Falling Off the Mountain Top:
1. Look for a bearish engulfing candlestick pattern in an uptrend. If you are not familiar with this pattern, here is information on engulfing patterns.

2. Check both RSI and Stochastics. Both must be in extremely overbought territory (above 70 or 80, depending on your preference).

3. Look for confirmation that the uptrend is over.

A. Both RSI and stochastics should break below your chosen overbought level. I focus on the stochastic more than RSI, and will sometimes make an entry when RSI has not reached overbought status but stochastics have.

B. Fast and slow stochastic lines should cross.

C. Price has moved below the bearish engulfing candle formation.

4. Enter and place stop just above the bearish engulfing candle formation.

This setup identifies stocks that are extended and may be topping. While it's always risky calling a top, the beauty of this setup is that it waits for confirmation of a fall, rather than trying to predict it. Also, it is low risk in the sense that the stop is so close to the entry point. Five losing trades can be all but forgotten with one big win, and the wins can be huge with this setup. If you used this setup over the past few months, you would have caught many of the energy and metal freefalls. Take a look at this chart of Goldcrop, Inc. (GG):


Notice that this setup caught the top of a head and shoulders pattern. This happens frequently. Here is information on other bearish patterns.

Short Setup #2: Falling Off the Hill
A second way to use this setup is on low volume pullbacks moving back up to the resistance level of a head and shoulders pattern, or any pullback to resistance in a bearish pattern. We're now talking about falling off a hill instead of a mountain, but it's still very profitable, and a little more safe since this pattern is now being used in the midst of a downtrend.

This second method is the way I'm currently using this setup in the energy and metal sectors. The big top has been made, and now stocks in these sectors are moving back up to the first major resistance point. I'll be looking for bearish engulfing candle patterns as these stocks become overbought near resistance. Valero Energy Corp (VLO) is setting up as a possible "falling off the hill" short candidate in the near future:

Friday, October 13, 2006

Today's Trades: BEAS, FLIR, HOV, STP, VLO, EWZ

I bought 600 shares of BEAS at $15.18. I like the NR7 "coiled spring" set up. I'll go over the chart this weekend.

I sold my 500 share position in FLIR at $28.50 (entry at $26.85) for an $825 gain (+7.0%). I was patient and made myself stick with this trade as long as my stop didn't get hit, and it paid off. I'm getting better at not micro-managing my trades, which has been my achilles heel.

I sold my 500 share position in HOV at $32.05 (entry at $29.90) for a $1075 gain (+7.1%). I still like homebuilders short term and will watch the $31 level for support.

I covered my 300 share position in STP at $27.05 for a $384 loss (-5.1 percent). Luckily I had covered the first 300 shares for a gain, making the entire trade a loss of only $84.

I sold all 500 shares of VLO at $53.25 (entry at $50.12) for a $1565 gain (+6.1%).

I coverd all 500 shares of my EWZ short at $41.45 (short at $40.10) for a $675 loss (-3.4%).

Overall, not a bad day. While the win to loss ratio was only 3:2, the wins were much bigger than the losses. The average win was $1155 while the average loss was $530. I made a total of $3465 for the winners and lost -1059 for the losers for a total gain of $2406.

I hope to update my trading results since September 1, 2006 this weekend.

Thursday, October 12, 2006

Chart: $SPX: Are We Ready for a Pullback?

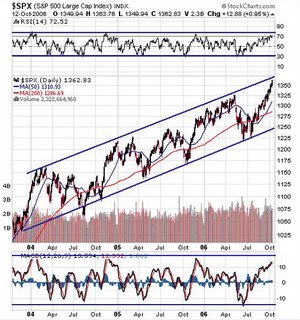
Take a look at the S&P 500 ($SPX) over the past 3 years. It cant' be this easy, can it? The envelope suggests you buy at the bottom and sell at the top of the envelope. The market looks overbought and ready for a pullback. A break of 1325 might be a good short opportunity.

Wednesday, October 11, 2006

Chart: SINA

One stock at the top of my watchlist is SINA (sina.com). The stock is pulling back on low volume after a high volume breakout. Note that the 50 day moving average is about to cross over the 200 day MA. The last time this happened the stock gained three points in a short time frame. The stock was pulling back after a breakout at that time as well. I may enter now, as I see an entry with a stop below just below the crossover point, say $24.20, as a low risk trade.

Important note: There does seem to be a topping pattern at play here. If my long strategy proved wrong and the stock did hit my stop and continued below $24, it would make for a low risk short entry.

Tuesday, October 10, 2006

Watchlists, Positions and Song from the Playlist (Nouvelle Vague)

Unfortunately I don't have the time to post charts tonight. However, here is a list of stocks I'm watching: TIE, BOOM, HAL, CMC, GG, GLD, LEN, DHI, PMTC, BLUD, PSYS and CTXS.

Long positions include: HOV, VLO, STLD
Short positions include: EWZ, NVDA

Off Topics:

There's something hypnotic about this clip. French group Nouvelle Vague's "Dance with Me" is set to the dance scene from the classic French movie "Bande a Part".

VLO and EWZ

I've had a ton of meeting over the past two days, hence the lack of posts. I've made a few trades, including a long position in VLO and an EWZ short. I'll update my trades tonight.

Monday, October 09, 2006

Chart: EWZ

I may short EWZ (Brazil iShares) if it breaks down below the 50 day MA at $38.99. Note the lower highs and volume on the decline versus the rise.

Sunday, October 08, 2006

Stick to Your Guns

"It is dangerous to be right in matters on which the established authorities are wrong."
--Voltaire

I am currently reading Hedgehogging by Barton Biggs, and a story he told made me think of this quote by the great French author and philosopher, Voltaire. During the height of the tech craze in 1999, Biggs had become gravely concerned about the astronomical valuations in stocks and felt a crash was imminent. So much so that he voiced his concerns to investors and debated tech "gurus" at conferences, only to be ridiculed by his opponents, pundits, gurus and the audiences he lectured. In fact, even his peers at Morgan Stanley were whispering that he had "lost it". Things got so bad that he started to doubt himself. Luckily he stuck to his guns. Four months later the market did exactly what he predicted.

So the next time you are sure that the investing community is dead wrong, think back to Barton Biggs and take the ridicule. Hurt feeling are better than a wallet that's hurting.

Friday, October 06, 2006

Chart: DHI

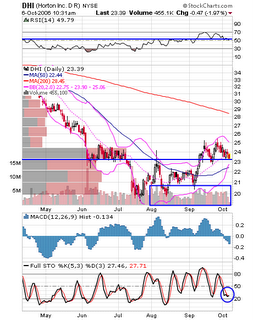
Intellectually my mind is telling me to steer clear of homebuilders, but how can I ignore the charts? Almost every homebuilder is showing a nice bottoming pattern with a breakout and pullback to support. Take a look at this chart of DHI (Horton Inc. D.R.). We have a steep decline, a bottoming base, breakout and pullback to support. On top of that, volume has been ideal, with above average volume on up days and below average volume on down days. This all leads me to believe that the big guys are slowly accumulating the stock. I have no idea why, as almost all economic data points to a a slowdown. However, we are traders, not economists or even investors. You've gotta go with the flow, and money is flowing into these stocks.

I'll be watching how the stock handles the support line at $23. A bounce might get me to buy for a quick trade, while a breakdown below the 50 day MA would get me in as a short.

Thursday, October 05, 2006

Trades, Volume Spread Analysis, NVDA and STP

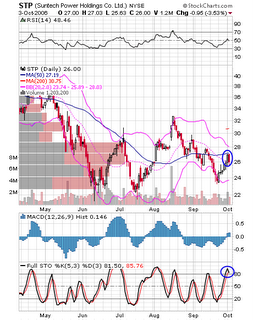
Yesterday I went short 600 shares STP (Suntech Power Holdings Co.) at $25.77. The bearish engulfing pattern worked out great, so I sold 300 shares at $24.75 for a $300 gain (+4.1%). I'm still short 300 shares, although the stock is showing a little strength this morning.

According to Volume Spread Analysis, a long bullish looking bar bumping into resistance on abnormally high volume is a good shorting opportunity. This chart of NVDA (NVIDIA Corp.) is a perfect setup. I went short 300 shares and have a stop placed just above resistance.


Tuesday, October 03, 2006

Today's Trades (AMLN and AAPL) and Chart (STP)

I covered the remaining 300 shares of AMLN at $42.20 for a $495 gain (+3.7%). The total gain for the trade was $825.

I covered the all 300 shares of the AAPL short at $73.75 for a $540 gain (+2.4%). AAPL is close to strong support at $72.50, so I may consider buying at that level.

Chart: STP (Suntech Power Holdings Co):
Here's as a nice a short setup as they come, a bearish engulfing pattern into resistance with stochastics crossing over in overbought territory.

Monday, October 02, 2006

Today's Trades (GG, AMLN, AAPL), Time frames and Chart Voodoo

I sold my remaining 150 share position in GG at an average price of $23.75 (entry at $21.71) for a $306 gain (+9.3%). The total gain on the position was $714.

I went short 600 shares of AMLN at an average price of $43.85. I featured this stock's chart in last night's post and it acted just as the chart predicted. I covered 300 shares at $42.75 for a $330 gain (+2.4%). I am still short 300 shares.

I went short 300 shares AAPL at $75.55, also featured in last night's post. Note the smaller position size. The fact that this stock is in the midst of an uptrend necessitated a smaller share size. I don't like to make big plays when I'm going against the trend.

I received alot of emails last night criticizing last night's analysis of AAPL. The two most frequent criticisms were:

1. The stock is in an uptrend and will do no more than pullback.

2. Charts are voodoo.

Regarding the first criticism, I agree. It is very likely that AAPL is going to resume it's uptrend. However, I am looking at the stock as a quick swing trade, possibly holding for no more than a day or two. What the stock does two weeks or two months from now is of no concern for me, although I do often trade that time frame. The point is, make sure you know what time frame you are trading when analyzing a chart and making an entry.

Now to the second point. In my opinion, anybody who says charts are voodoo either has a personal bias against technical analysis or just doesn't understand chart reading. Charts are like footprints, showing us exactly where money is flowing. An emailer accussed me of being lucky today with the downgrade. Sorry sir, but it wasn't luck. Yes, I did not know there would be a downgrade today. However, the chart did warn us that bad things were coming. Do you really think nobody outside the downgrading firm knew about the upcoming downgrade? If that's what you think, I've got a plot of land in Oklahoma I'd like to sell you, at Manhattan prices. Chart reading is "our" way of evening the playing field.

Sunday, October 01, 2006

Charts: AAPL, MT, OIS, AMLN

Although the indices are above support, I'm having a heckuva time finding long candidates. Here are some charts from my short watch list:

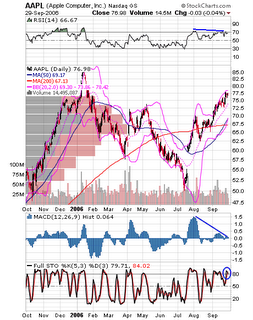
AAPL (Apple Computer Inc.)
This one's a risky play, as AAPL is in the midst of an uptrend. However, RSI and MACD are not keeping up with the move, and stochastics have crossed over in overbought territory.


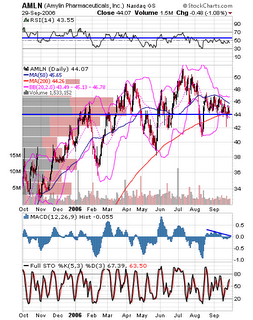
AMLN (Amylin Pharmaceuticals, Inc)
The chart shows a topping pattern developing.


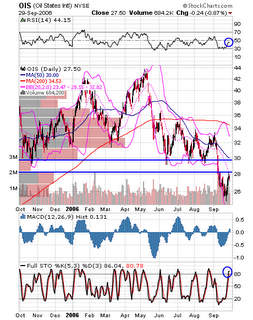
OIS (Oil States Intl)

Like many energy stocks, OIS is pulling up to resistance with an overbought stochastic reading.


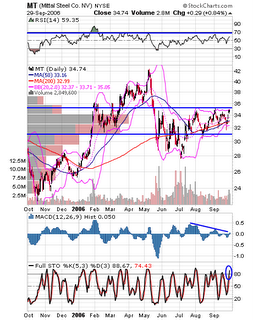
MT (Mittal Steel Co.)
As with OIS, MT is pulling up to resistance. Be careful with this one, volume has been picking up. I would watch for confirmation before initiating a short. If the stock breaks out, I'll go long.


The "Completely Uncalled For" Guys Sign With NBC . . .The Power of YouTube

Many of you liked the "Completely Uncalled For" clip I posted last week. Well, the two students from Gonzaga University, BaratsandBareta, just signed a production deal with NBC. These guys are doing better stuff than anybody on Saturday Night Live, so thank god for the newfound power of YouTube. Check out these hilarious clips and get ready to bust a gut . . .

So Smooth (you guys will love this one!)


Mother's Day


Auto Insurance


Theme Song


Cubicle Wars