Wednesday, January 31, 2007

CAL's Inverse Correlation with Energy

Today I went short on CAL, an airline stock, and went long USO (U.S. Oil Fund). Most likely, this trade is either going to pay off handsomely or hurt badly. I don't see much hope for any middle ground, as the stocks have had an inverse correlation over the past month. Oil goes up, airline stocks go down, and vice versa. I probably should not have played two entries that are so closely tied to one another. However, the charts told me those were the moves to make, so I didn't talk myself out of the trades.

Take a look at this chart below comparing CAL to OIH over the past month (USO's move is very similar to OIH), and note how perfectly these stocks move against each other.


Today's Trades: CAL and USO

I re-entered a 500 share short position in CAL at $41.60. This is an aggressive play, as the stock has not yet broke the forming head and shoulders pattern.


I also bought 500 shares of USO at $46.80. My target is $50, which is just under the 50 day moving average. The MACD and RSI look good, although I am a little concerned about the lack of volume on this upswing, in relation to the volume on the downturn. My gut is telling me to ignore the volume trend becausethe increased volume on the downswing is a sign of capitulation (note that volume during the "meat" of the move was actually quite low), but only time will tell.

Tuesday, January 30, 2007

Michael Jordan Trading Quotes


As you may have noticed in my "inpirational photos" post, I am a big Michael Jordan fan. Not only was he one of the most talented players to ever grace the hardwood, he also was one of the most hardworking and mentally prepared. Growing up, I watched and listened to everything Jordan related that I could get my hands on. What I took away from Jordan, more than anything, is that you must have confidence in your abilities, strive to continually make yourself better, be determined and outwork your opponent. Here are a few quotes, that as traders, we can all benefit from.


I never looked at the consequences of missing a big shot... when you think about the consequences you always think of a negative result.

I play to win, whether during practice or a real game. And I will not let anything get in the way of me and my competitive enthusiasm to win.

I've always believed that if you put in the work, the results will come. I don't do things half-heartedly. Because I know if I do, then I can expect half-hearted results.

I've missed more than 9000 shots in my career. I've lost almost 300 games. 26 times, I've been trusted to take the game winning shot and missed. I've failed over and over and over again in my life. And that is why I succeed.

If you accept the expectations of others, especially negative ones, then you never will change the outcome.

If you're trying to achieve, there will be roadblocks. I've had them; everybody has had them. But obstacles don't have to stop you. If you run into a wall, don't turn around and give up. Figure out how to climb it, go through it, or work around it.

My attitude is that if you push me towards something that you think is a weakness, then I will turn that perceived weakness into a strength.

Some people want it to happen, some wish it would happen, others make it happen.

The game is my wife. It demands loyalty and responsibility, and it gives me back fulfillment and peace.

Today's Trades: EWZ and RIO

As discussed last night, EWZ looks attractive as a pullback candidate, so I bought 500 shares at $46.10.

I bought 400 shares of RIO at $32.25. I've been waiting for a decent entry in a steel/metal stock for quite some time now, and finally found a decent pullback. I placed my stop at $30.90, just under the last breakout. Note the smaller position size. The fact that the stock has been on such a tear required me to take a reduced position.


Monday, January 29, 2007

Brazil is Hot! EWZ Chart.

EWZ is setting up for a nice pullback entry. While the solid uptrend and pullback to the 50 day moving average are nice, what really makes this stock attractive is the surge in volume this month. The big money is definitely flowing into this Brazilian ETF.

Some Clips

What if a great man of the last century – Gandhi, say – had had access to the communications networks of our age when he made one of his most important speeches?" The result is 'Telecom Italia Gandhi', an astonishing 60-second spot that has just started airing in Italy.


Peter Gabriel - Here Comes The Flood, from the Growing Up Live tour, Milano 2003


For football and 49ers fans, an interview with the genius, Bill Walsh. I recently read his book for pure enjoyment, but found myself constantly taking notes that would relate to trading practice.


Barick Obama's Plans for 2008


Jim Cramer on the Colbert Report, January 2007

Trade Update: CAL

I was stopped out of CAL for no gain or loss (minus commission cost, which I don't factor on the site). I still think many of the airline stocks are setting up for a a fall, but it looks like they are going to bounce a bit before they do. I may enter again later this week.

Saturday, January 27, 2007

Inspirational Sports Photos From My Office

Here are a few of the many pictures that adorn the walls of my home office. All are intended to inspire excellence.

Friday, January 26, 2007

Today's Trades: CAL and BLUD

As I noted last night, the airlines and CAL were high on today's watchlist. I went short 500 shares of CAL at $41.65. The stock is at $40.77 as I type this, so I may move my stop up to my entry level.

I came close to getting out of the BLUD trade, but I like the way the stock has bounced off of the 50 day MA. For the time being, I'm still holding on.

Market Notes, Watchlist and Resolutions Revisited

The Market:
Today was a scary day for anybody who is holding onto long positions, and it was tempting for me to jump out of my position in BLUD. However, we have to keep in mind that, over the past few months, every big sell off has been a buy the dip opportunity. As I type, no major support levels have broken, so we must treat the market accordingly. Tomorrow will be telling. If support levels do break, I will look to get out of longs and start shorting.

Sectors on my radar for possible shorts include paper, semis, airlines, biotech, healthcare and utilities. Of these, paper looks the most promising, as it already has broken below it's 50 and 200 day moving averages. Biotech is sitting right at it's 50 day MA. The airlines have come back to earth, and CAL looks to be setting up as a nice short play.

Resolutions Revisited
Here is an update of my six New year's resolutions.

1. Read a book every week:
So far, so good. After three full weeks, I have completed three books.

Tao of Bruce Lee, was an autobiographical account of a scrawny, loser kid who used Bruce Lee's teachings to become a success in life. It also has some little known tidbits on Bruce Lee's life.

Week two was a book that will be of interest to anybody reading this blog, Enhancing Trader Performance by Brett Steenbarger. This was a great book that I will review shortly. It motivated me to work harder to be a better trader.

I just completed Pat Riley's Winner Within. It's an enlightening self help book that uses his experiences coaching the Lakers to bring home his philosophy on management. An added benefit is the amount of inside info dished out the 80s Lakers.

2. Define my risk, stop and target before every trade and let those preset parameters work for me.

This has become such a habit now that I probably don't even need to keep this on the resolutions list.

3. Review my trading journal on a monthly basis (I already do this), integrate my findings into my trading style, and report my finding on this blog.

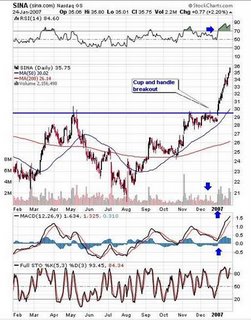
While it has not been a month yet, I am taking my trading journal reviews much more seriously. These reviews have lead me to research specific setups much more closely. My findings have me trading a few setups more than I normally would, such as the cup and handle and head and shoulders patterns. I also have been reviewing not only my trades, but my watchlist as well, as shown in this review of the SINA non-trade.

4. Become an early riser.

I have not even attempted this one yet. Having kids is makig this one tough. I would really love to wake up at 4 or 5 every morning though. As I found out last year, it makes a huge difference in my productivity.

5. Workout goals:
A) Run three miles 4 x/week (currently don't run at all)
B) Bench press 250 x 5 (currently at 205 x 5)
C) Barbell curl 135 x 8 (currently at 95 x 5)
D) Squat 250 x 5 (don't know current ability)

I've been keeping up with my workouts, and have increased in A-D. I'm up to running 2 miles/day. My bench press is 215 x 5, curl is 105 x 5 and squat is 185 x 5.

6. Try something new every month.

I was supposed to snow board this month, but it doesn't look like that will happen. However, I did watch my first hockey game. I am a huge sports fan, but I've never watched a hockey game and usually change the dial when ESPN shows hockey highlights. A buddy at work got me to watch the NHL All Star Game, but honestly, I'm not hooked. BTW, why is it that when hockey players fight, it's considered a beautiful thing, but when NBA players throw down, it's portrayed as a tragedy? It smacks of racism, if you asked me . . .

I also tried a new Chinese restaurant, called Big Bowl. It was terrible. I'm not a fan of westernized chinese food, a la PF Chang.


Thursday, January 25, 2007

Reviewing Missed Opportunities: SINA

One of the most important steps I've taken to become a better trader is to periodically review "missed opportunities". While there is a seemingly infinite number of stocks that can be reviewed, I narrow it to stocks from my watchlist.

A stock that is always on my watchlist that I missed out on is SINA. It's a mainstay in the "China stocks" wing, and had moved into my primary list as it based under $30. Technically, it was a beautiful setup. We had a cup and handle formation that had yet to breakout. That's what moved it to my primary list. Once breakout occurred, MACD turned positive, RSI was strong and volume had picked up. This is one of my favorite entries, and for some inexplainable reason, I passed on it. I've been riled up over this missed trade for the past few days.

Why did I pass on it? Looking back, I had placed a note in my watchlist that said, "I have been burned by hot Asian before". Anybody remember my REDF trade? While I only suffered a small loss on that trade, for some reason it had a negative impact on me. So much so that it made me doubt a beautiful technical setup a week later.

What I learned from this review is I must have a short memory when it comes to bad trades that were made from good setups. When I enter a trade, I must take emotion out of the equation and purely focus on the technicals. If there is a good setup, I enter, no questions asked. Here, I had it right technically, but dropped the ball mentally. I'm going to have to work on that.


Please note that I am not saying you should ignore your losses. On the contrary, losses should be scrutinized from every angle. However, if you come to the conclusion that the trade was a good one and that you just ended up on the wrong side of a low risk trade, you must move on and erase the trade from your memory. A trader who is trigger shy is equivalent to a basketball player being afraid to shoot because he missed his last uncontested shot. Once doubt enters into the equation, it's game over.

Wednesday, January 24, 2007

Today's Trade: BLUD and FTEK

I was stopped out of FTEK at $26.50 (glad I used a tight trailing stop) for a $670 gain (+5.3%).

I bought 500 shares of BLUD at $32.25. The stock has pulled back to breakout support on low volume, in the midst of a nice uptrend. I'm still debating how to the play the stop. It's currently just below the early January breakout level ($30). However, I may move it up to the more recent breakout at $31.90, if I decide to play it tighter.

Tuesday, January 23, 2007

Be like FTEK

The FTEK trade has performed nicely thus far. Below is a list of 10 stocks that have a high correlation to FTEK over the past six months, courtesy of SPDRs correlation tracker. This list is the starting point for my research tonight.

Monday, January 22, 2007

Be Like Water My Friend


Empty your mind
Become formless, shapeless
Like water
Put water in a cup, it becomes the cup
Put water into a bottle, it becomes the bottle
Put water into a teapot, it becomes the teapot
Now water can flow or it can crash
Be like water my friend

--Bruce Lee

If you guys haven't figured it out already, I am a huge Bruce Lee fan. In fact, I've patterned much of the way I live my life from his teachings. He was more than just a fighter, he used martial arts to convey his life philosophy. A philosophy that, if applied correctly, can make you a success in any field.

Lee's famous "be like water" quote is an apt tenant for successful traders. Brett Steenbarger, in his excellent book "Enhancing Trader Performance", stresses how important it is for a trader to be able to adapt his strategies to different markets and continually, even obsessively test different methods. In essence, to become an expert you must become water; a formless, shapeless entity able to adapt to her changing surroundings.

Today may have been a tipping point, as the market is giving clues that a change may be coming. If the clues prove to be correct, will you stick with what's worked over the past few months, or will you take Bruce Lee's words to heart, and become like water?

Note: If you were linked here from another site, thanks for visiting and please check out the rest of my site.

Today's Trade: FTEK

I bought 500 shares of FTEK at $25.16. I did not get too complicated in my analysis on this one. The stock has been in a nice uptrend and closed strong on Friday after testing the 50 day MA. I love when stocks make a long tail and close strong off of a major moving average in the midst of a solid trend. I placed a stop under the 50 day MA ($24.50), with my initial target at recent highs ($28). That makes for almost a 4:1 reward vs risk.

Sunday, January 21, 2007

False Breakout: COGN

On Monday I pointed to a nice looking setup taking place in COGN, as it had cleanly broke through resistance. However, what happened next is what is known as a "false breakout". The stock quickly sunk back below resistance.

On the chart below, I have placed a vertical line where the breakout occurred. Notice that RSI gave a higher reading during its November highs. I had noticed this negative divergence, which is why I decided against entry.

Now the stock is setting up on the short side. When I see a false breakout at new highs that occurs where there is negative RSI divergence, I like to enter on the short side when the stock breaks below the previous highs. Here, the new highs occurred at $40 (not shown on this chart, but the stock reached $40 in April). If we see a break below that level, it would be a good time to short. The 50 day moving average may also provide a good short entry level (although I've yet to test this type of moving average setup).

I would not play this trade aggressively by shorting early. We still don't know if this is an orderly pullback or a move down (at least I don't). RSI and the false breakout point towards a breakdown, but not technical barriers have been broken just yet.

Saturday, January 20, 2007

The Wisdom of Bruce Lee


“I fear not the man who has practiced 10,000 kicks once, but I fear the man who has practiced one kick 10,000 times.”

--Bruce Lee

I had an e-mail exchange yesterday with a reader that reminded me of my early days in trading. The reader has been analyzing the way I trade and noticed that I only trade a handful of patterns. His question was, "why are you limiting yourself to these few patterns when there are so many out there that work?" He then proceeded to list all the patterns he trades and some opportunities I had missed out on.

My response was the above quotation from Bruce Lee. I would rather master a few patterns than become a jack of all trades and master of none. As you may have noticed, a pattern that I'm currently working on is the "head and shoulders" pattern. Is knowing what this pattern looks like enough to mint money off this pattern? Take it from my first hand past experience, the answer is a resounding no! To truly master the pattern, you need to know how this pattern reacts with volume, price bar length, and indicators such as RSI, stochastics and MACD. Of course, that's just a starting point. The next step is to test different markets and sectors. After that, you test . . . well, I think you get the point. It's better to intimately know a few strategies than to be moderately fluent in many.


Friday, January 19, 2007

Some Ugly Looking Stocks

I spent the morning using this correlation tracker (thanks to The Kirk Report) to find stocks that look similar to GROW, one of the ugliest looking chart patterns out there right now. Here are the eight stocks that correlate best. I think I've found some nice short setups!

Thursday, January 18, 2007

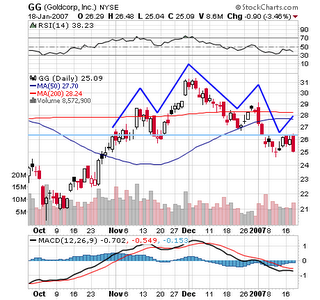
Chart of Today's Trade: GG

GG made the downward move that I expected it would. Now that I've gained a full point, I will lower my stop to my short entry point, thus making this a "risk free trade." I will either make money or break even. I usually would take partial profits on a trade like this with a quick gain, and let the rest ride. However, the stock is in the midst of one of my favorite short setups, so I've decided not to take partial profits and instead go with the "risk free" stop strategy.

As we can see from the chart below, the stock broke down through support off of a head and shoulders pattern. When I see a promising breakdown, I usually wait, rather than entering on the break. I have been burned one too many times by false breakouts. Instead, I look for a low volume pullback to what now should be the resistance line. If volume is low, I enter in anticipation of another leg down. High volume nullifies the setup.


This was my strategy for short entry today. As the stock neared the resistance line on very weak volume, I entered with a stop just above resistance. My initial risk was only 75 cents. My target is right around $23, the next area of congestion. If we reach that point, I will either take partial profits or exit the trade completely, depending on how the stock is acting.

Today's Trade: GG

I went short 500 shares of GG this morning at $26.20. I'll have more on my reasoning and a chart later today.

Charts: AOB and QQQQ

I've been noticing some nice biotech charts of late. AOB is a good example:


There seems to be a lot of negativity about today's drop in the Naz today. Looks like a nice low volume pullback to me. The QQQQ chart looks enticing as a buy the dip play, as long as it holds the support level.

Wednesday, January 17, 2007

Today's Trade: REDF

I bought 500 shares REDF at $19.11. The stock made it to my primary list last night. After doing my sector review, I came to the conclusion that internets are breaking out and look like they are setting up for a big move. After narrowing down internet stocks, VCLK, REDF and and KNOT made my primary list. I went with REDF since it features good risk reward, positive on MACD and it was nearing short term resistance at $19. My stop will be placed just under price and moving average support at $17.90, with an initial target of $21.

Tuesday, January 16, 2007

Chart: BOOM

BOOM has had trouble handling the middle bollinger band (20 day moving average) and is bouncing towards that level. RSI and price also provide resistance areas that will need to be mounted before reversing the downtrend.

update: sorry for not pointing out that this is a short setup (as long as it stays under $28).

Monday, January 15, 2007

Chart: COGN

Anybody trading AAPL? If you are, take a look at the chart of COGN (Cognos, Inc.). These two stocks show some uncanny similarities: vertical moves from November to December, basing and a pullback from highs, a recent emergence and breakout above those old highs, and positive MACD. They even share the same concern: RSI divergence.

I may enter tomorrow, with s stop placed just under the old highs.

Saturday, January 13, 2007

Links of the Week

{New viewers, thanks for visiting, and please visit the rest of my site}

Trading Links:


A new way to use RSI.

Thirty stocks for traders to watch.

Handicapping the odds of hitting pivot points.

In trading, sometimes you need to change your state of consciousness.

Find stocks that correlate with a big winner.

Trader tool talk.

Sports Links:

The funniest writer in sports talks football.

Scoop on Da Bears.

A sports handicapper who approaches his trade as a trader would.

Drew Brees is a thinker with a quick release.

My weekend picks: Philly over Saints, Ravens over Colts, Bears over Seattle and Pats over Bolts.

Psychology:
Achieving goals by improving character.

Win by showing up.

Faster goal achievment podcast.

Brain workout for you frontal lobes.

My favorite Zen site.

Friday, January 12, 2007

Chart: AKAM

AKAM (Alkamai Technologies, Inc.) has been on my bearish list of late, but things have changed since the stock followed through today off a bullish englulfing candle pattern. Also note that the MACD looks ready to turn positive. Things will get interesting if the stock can clear recent highs on decent sized volume.

Thursday, January 11, 2007

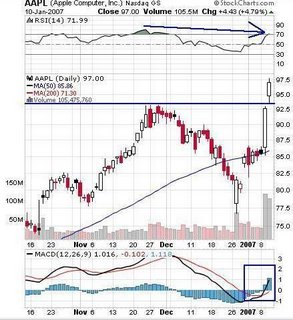
Chart: AAPL

I know we've all had AAPL overload for the past few days, but this stock cannot be ignored. After undergoing a brutal shakeout, today the stock obliterated it's recent all time highs. What's not to like? The stock gapped up over resistance, closed at the day's highs on nice volume and the MACD indicator has turned positive for the first time in over a month.

Normally, I would jump in right here. However, two things concern me. First, RSI is showing a bearish negative divergence in price. Take a look at the big arrow in the chart below. Hot stocks have a tendency to ignore divergences (which is why I always wait for confirmation before shorting a divergence), so I wouldn't worry too much here. When a stock breaks out on nice volume and with long bars, I usually ignore the divergence. However, it still should be noted. Second, the stock is nearing the $100 level. I usually like to wait until the stock clears a major round number, as profit taking is likely as the stock nears the number.

Because of these concerns, I'm not going to jump in just yet. I'll wait to see how the stock handles the old highs and the $100 level. If the stock pulls back to $93 and then starts back up on nice volume, I'll make an early, aggressive play. If not, I'll wait for a breakout over $100.


Wednesday, January 10, 2007

Today's Trade: HANS

I bought 500 shares of HANS at $36.04.

I had HANS marked for entry on a breakout over $36 resistance, and it easily blew past that level this morning. I sold have of my position at $37.65 for a $412.50 gain (4.5%). My target for the remaining 250 shares is $40, the last gap level.

Technically, the stock has a strong RSI and MACD readings, and just broke from a bollinger band volatility squeeze.


Tuesday, January 09, 2007

OT: Mark McGwire and the Travesty that is the Hall of Fame

Today, the Baseball Writers Association of America committed what I would call a baseball sin, by denying legendary slugger Mark McGwire induction into the Baseball Hall of Fame. I could type until I was blue in the fingers, providing stat after stat showing that McGwire deserves to be in the Hall, but it would be in vain. You see, nobody, probably not one writer who voted, would disagree with the statement that Big Mac has the numbers required for enshrinement. Hell, only six other players in the history of the game have more home runs. Mark McGwire was not enshrined for an altogether different reason: the suspicion that he used illegal performance enhancing drugs, such as steroids or growth hormones.

The second half of McGwire's career was played in what will likely go down in history as the "steroid era". While few players have been outed, this was, and still is, a period when average athletes turned into stars, and stars turned into physical specimens, the likes of which have never been seen. Thirty years ago, who could have ever imagined we would see second basement that looked like linebackers and could hit balls as far as the Babe did over fifty years ago. Only twenty years ago, who would have ever thought there would be a Big Mac.

Mark McGwire is the most physically imposing player to ever play the game. Paul Bunyan had nothing on his 6'6", 260 pound chiseled frame. To put things in perspective, Babe Ruth was a larger than life behemoth in his day. He weighed 220 pounds, much of it softer than a jelly doughnut.

Does McGwire's imposing body make me wonder if he ingested steroids? Sure it does. But, as Clive Owen would say, here in lies the rub: there is no tangible evidence that Mark McGwire ever took an illegal drug. Yeah, I know, he looked bad when ordered to speak in front of Congress. So what? As a fan of the Oakland Athletics, I watched him look equally inept in front of reporters, when talking about baseball. If being articulate is a requirement for innocence, we as a society have some explaining to do.

I was taught that you draw conclusions based on evidence. There is nothing worse than being accused of something you did not do, especially when it is based on flimsy "proof". I hate when my wife does it. I can't imagine how I'd feel if an entire country branded me a cheater, at something that was my life long passion. Until somebody, anybody, can provide real, tangible evidence that Mark McGwire cheated the game he loves, baseball's sports writers are cheating him by keeping him out of the Hall.

Monday, January 08, 2007

Chart: FCX

Metal related stocks have provided a nice bounce for those of us who missed out on the recent decline. A prime example is FCX (Freeport McMoran Copper and Gold). The stock broke down below the double top support line on heavy volume, and is now pulling back up with small candles and lower volume. This is a textbook dead cat bounce setup, which puts this stock at the top of my watchlist. Note that this setup is invalidated if the stock pushes past $54.

I can already anticipate receiving an email that reads: What is the difference between this stock and XLE, which you entered on the long side today? To be honest, not a whole heck of a lot. However, while XLE has the chance to bounce above the 200 day MA (since it has not broke below it yet), FCX has clearly broken down, and now the 200 day MA is providing resistance, rather than support.

Today's Trade: XLE

I've decided to go for a low risk "catch a falling knife" play. Over the past three years, XLE, an energy ETF, has had some nasty selloffs that tend seem to reverse at the 200 day MA and 30 RSI. The stock has dipped just below this level late last week, but gapped above the moving average today. I bought 400 shares at $56.21. I placed a below the 200 day MA and last week's price bars at $55, with a target near resistance at $60. My initial risk is $1.21, with a reward of $3.79.

Note that when I say this trade is "low risk", I am not saying there is a high probability that this trade will work out. In fact, there is a decent chance my stop will get hit, considering the stock broke the 200 day by two points or more twice last year before resuming the trend. My use of "low risk" refers to the reward/risk ratio. Ideally, I'd like to use a stop just under $50, but that doesn't work for my risk parameters or the time frame I am trading (1 day-1 month).

Sunday, January 07, 2007

Short Term Traders Should Keep an Eye on the Bigger Picture

When I post charts, I usually only show the past three to six months. For my style of trading, this time frame usually offers the best predictive value. However, I always take into account the longer term chart. I am looking for levels of support, resistance and chart patterns that are hidden on the shorter term chart, but still matter.

Let's use VLO (Valero Energy Corp.) as an example. The three month time frame doesn't offer many trading clues. There are some weak S/R levels, but I don't see much of a pattern. While VLO is always on my watchlist, based on this chart it would not crack any of my primary lists. The stock does look like it has dropped to an area of strong support, is way oversold and may react with a bounce. If it breaks down at support, we could see a further drop, but I have no idea how much of a drop to expect.


Now lets take a look a longer term chart going back to 2004. Talk about a different perspective! Here, we see the stock had been in a strong uptrend and only recently has begun to falter. In recent months, the 50 day moving average crossed below the 200 day for the first time during this period, which is a bearish sign. We can also see a double top that has been forming since the beginning of 2006, with the breakdown point at around $46. Another wonderful nugget is that the stock has been, at the least, a short term buy everytime it has hit 30 on the RSI.

Although I am not trading on the 3 year time frame, this chart has fleshed out some trading strategies for this stock. I can expect a bounce if the stock hits an RSI reading of 30. I see that a "dead cat bounce" in the longer time frame could reach up to $55-60. A breakdown at $46 will be a signal to enter short off a double top pattern. Once the stock comes close to any of these numbers, I can then switch to a shorter time frame and look for more precise entry points.


These two charts provide a good example of hidden areas of support and resistance that lurk on short term charts. The next time you wonder why a certain stock mysteriously hit a brick wall at some seemingly arbitrary level, change your perspective and take a look at the bigger picture.

{If you linked here from another site, thanks for visiting and please visit the rest of my site.}

Friday, January 05, 2007

Today's Trade: GROW

I covered the final 200 share position of GROW at $55.06 (entry at $71.95) for a $3378 gain (+24%). The total gain on the 400 share position was $4804 (+17%), making it one of the best short term trades I have ever had.

The trade could have been better, as I almost covered when the stock broke below $54. Instead, I put a stop at $55, and of course, it bounced back up. On the bright side, I am lucky that I put that stop in to protect profits, as the stock is now trading above $57.

While it's too early to tell, my guess is that GROW is not a broken stock. We are just seeing some healthy profit taking before the next move up. However, if the stock breaks down below the 50 day MA and round number $50, it would signal another shorting opportunity for me.

I've received a number of emails asking me how I was able to predict the fall in GROW. While I certainly do not have a crystal ball, the fact that the RSI did not confirm the new highs was a red flag that the stock would not sustain its momentum. As I explained in my post when I entered, this is one of my favorite setups.

Thursday, January 04, 2007

General Dynamics Revisited

GD (General Dynamics Corp.) has been a good "buying the extremes" play over the past few months. If you had bought the stock in late October, when the stock hit an extreme stochastic reading, and sold once the stock was extremely overbought, the trade would have been good for a 4 point gain. In December, over a shorter holding period, you would have been good for almost a 3 point gain. The stock is nearing oversold status again, and I'll be looking to buy near past support levels *if the stock reaches a 20 or lower stochastic reading*, and the stock stays above the $72 support level.

Another way to play GD is to wait for the stock to breakout of it's current trading range. Volume by price bars show strong resistance right around $75. There's room to move if the stock can breakout at this level.

Keep in mind that holding times for this trade are a little longer than usual (2-4 weeks). Also, you must give yourself some room on the stops. In November, after hitting extreme levels, the stock dropped another point before lifting off. A good stop point for the current trade would be under $72, although I'd probably place it at $71.

Wednesday, January 03, 2007

Today's Trades: QID and GROW

As I outlined last night, I bought 500 more shares of QID at $53.35 this morning. I started to get queezy as the stock broke below the 50 day MA, but I stuck with the trade as I am mindful that there might be some weak New Year euphoria, so I've used a very loose stop under price congestion right around $50-51. Things are looking great now, as the ETF has bounced back over $55 after the beautiful reversal in the Nasdaq (at least beautiful to those shorting it or long the QID).

I also covered half my 400 share short position in GROW at $64.82 (short at $71.95), for a $1426 gain (+10%). I am holding on to the remaining 200 share short position.

Today has been a nice, albeit nerve racking, way to spend the first trading day of the year!

Tuesday, January 02, 2007

Chart: QID

I already have a 500 share position in QID, which is an ETF that double shorts the Q's (I love the increased volatility!). On Friday I was a little nervous, as the stock looked like it would breakdown below the 50 day moving average. Luckily it reversed towards the end of the day and printed a bullish tail. Stochastics, RSI, and MACD continue to look so strong that I may enter again, either now or on a break of $55.

Monday, January 01, 2007

New Year Resolutions

As many of you, I always start off the new year with a few resolutions. I usually keep them to myself, but as Steve Pavlina points out, it is best to make your resolutions public. This way, you have put it on record and hold yourself accountable to your readers.

1. Read at least one book every week.

2. Define my risk, stop and target before every trade and let those preset parameters work for me.

3. Review my trading journal on a monthly basis (I already do this), integrate my findings into my trading style, and report my finding on this blog.

4. Become an early riser.

5. Workout goals:
A) Run three miles 4 x/week (currently don't run at all)
B) Bench press 250 x 5 (currently at 205 x 5)
C) Barbell curl 135 x 8 (currently at 95 x 5)
D) Squat 250 x 5 (don't know current ability)

6. Try something new every month.

I plan to regularly post on these topics. For those of you only interested in my trading posts, I'll title these posts "Resolution Updates", so you can ignore them if you like.

I am jumping in today with with reckless abandon, or as Steve Pavlina recommends, overwhelming force. Today, I woke up at 5 am (which was tough after going to be late) and promptly went down to the basement to work on my bench press routine and run. On bench press, I did three sets of 205 x 5. I ran one mile in about 10 minutes. I'm on my way to achieving resolutions 4 and 5!

I am on page 50 of Brett Steenbarger's Enhancing Trader Performance, thus making progress on resolution 1.

Resoltuion 2 can only be completed as I trade, so expect an update if I trade on Wednesday.

I will work on resolution 3 this coming weekend, going over my December trades and posting my results here.

I haven't figured out what new thing to try this month. I'm debating between taking a crack at snowboarding or doing something easier like trying a new restaurant. If anybody has any suggestions, send them to SinghJD1@aol.com


Words of Inspiration:

From now until Janurary 15th, I will conclude every post with the full video of Martin Luther King's historic "I have a dream" speech. If you haven't already, please take the time to listen to the speech in its entirety.

Chart: GD, and Martin Luther King's "I have a dream" speech

General Dynamics (GD) has a promising looking chart with price action near one year highs. During January, I will be watching to see how it handles the $78 level. If it can breakout on high volume and we see an increase in RSI, the stock could be good for a nice rise. However, average volume and an RSI reading below 70 would signal a false breakout and might even be a good, quick short opportunity.


Words of Inspiration:

From now until Janurary 15th, I will conclude every post with the full video of Martin Luther King's historic "I have a dream" speech. If you haven't already, please take the time to listen to the speech in its entirety.