Here are the notes I wrote to myself last night:
Control your emotions. Do not feel the need to make any big bets or predictions. Do not feel the need to make money out of this fall. It's okay to make some bets, but make sure to use a small position size or control risk.
Expect a dead cat bounce in the next few days. The key will be what happens after the bounce.
Do not watch CNBC. I'm cool with reading from sites and blogs of people I respect, but no TV.
Adhere strictly to stops.
Keep it simple stupid. Watch major support and resistance lines. Don't make plays that are in no man's land.
Keep it simple stupid. Narrow the stocks you follow. At this point, only play major momentum stocks and market leaders, index ETFs (leveraged), sector ETFs and one or two stocks from sectors of interest. That's it. At least for the time being.
Trades:
I already mentioned the QID trade. I bought 1000 shares at $53.82.
I sold 500 shares of CENX at $45.80 for a $920 loss (3.8%).
I sold 100 shares of GS at $207.05 for a $695 loss (3.4%)
I sold 50 shares of GS at $205.24 for a $146 loss (1.4%)
I sold 500 STLD at $37.45 for a $1285 loss (6.9%)
I made two day trades yesterday, along with a short that I covered today.
I bought 1000 QID as it broke past $53 ($53.11) and sold at $54.43 for a $1320 gain (+2.6%).
I bought 400 DXD (double short Dow 30) at $58 and sold at $59.26 for a $504 gain (+2.1%).
I went short 500 shares LEH at $74.93 and covered at $73.60 for a $665 gain (+1.8%).
I am still holding on to RL. I am watching QID, DXD, DDM and QLD (all leveraged index ETFs) closely. Sectors of interest include energy, retail, brokers, metals and other commodities. I am also keeping a close eye on Latin America and Asian ETFs.
If you were linked here, please view the rest of my site
Wednesday, February 28, 2007
Quick Update
I've received a number of emails looking for updates. Sorry for the delay, guys. Yesterday was a crazy day. Along with the market tumble, things went haywire at work and my daughter was sick. I hope to have an update within a few hours.
I've made a number of trades since my post yesterday. Today, I bought 1000 shares of QID at an average price of $53.82. Further updates to come, along with my current trading strategy.
I've made a number of trades since my post yesterday. Today, I bought 1000 shares of QID at an average price of $53.82. Further updates to come, along with my current trading strategy.
Tuesday, February 27, 2007
Trade updates: QID, STLD, GS, VLO, EWZ
Man, I'm kicking myself for getting rid of QID yesterday! Stupid, stupid, stupid! I hate myself right now. I should have let the trade play out until it hit my target or stop. Micro-managing at its worst.
I'm holding on to most of my positions right now, and actually made a few buys. I bought 50 more GS at $208.16 and 300 STLD at $37.55. I also bought 300 shares of VLO at $58.04 and 200 shares of EWZ at $46.55. For now I am holding on to RL.
Note that I am using smaller position sizes. The prudent move right now is to wait this thing out, so if you're going to buy, be very careful. I'm not giving myself much rope on these trades and will clear out my positions if they fall much further.
It will take some time to see whether this is just a hiccup or a new trend. If we get a weak bounce or more weakness in the coming days, it will be a sign to get ready to short.
Today's Trades, Watchlist
I sold all 600 shares of QID at $50.61 (entry at $49.85) for a $456 gain (+1.5%). I exited before hitting my target price. I'm worried that the recent strength in semis could lead to an upward breakout in the Nasdaq.
I bought 100 shares of GS at $214.45. It can be nerve racking buying hard dips in financials. However, this stock, and sector, has persevered through every dip over the past 6 months. I looked at many of the major financial stocks, and of course, GS is the cream of the crop. While all have been buys off dips, only GS has consistently held up at the 20 day MA (mid Bollinger Band). This is a sign of a strong stock in a mean uptrend.

Watchlist Notes:
FFIV: pb 76-77, stop 75
NTEL: overbought. short strength?
AKAM: pb to 50 MA
SSRI: buy pb to 20 MA
AL: HTF
RYI: HTF after BO
VLO: buy pb to 57
EWZ: buy pb to 20 Ma
This watchlist is merely a list of stocks to watch. It is not a buy recommendation. Even if a stock meets parameters listed, other factors may cause me not to trade the stock. For example, a high volume decline to buy target, rather than a low volume pullback.
abbrevations:
pb=pullback
HTF=high tight flag formation
BO=breakout
MA=moving average
Monday, February 26, 2007
Zen, Pullbacks and Boom
It is as though you have an eye
That sees all forms
But does not see itself.
This is how your mind is.
Its light penetrates everywhere
And engulfs everything,
So why does it not know itself?
--Foyan (www.dailyzen.com)
More in this quote tonight, along with my trades and tomorrow's watchlist.
Note to those who read my watchlist this morning. The free fall in BOOM today does not constitute a buyable pullback to support. Pullbacks on high volume or off long price bars are to be treated as kryptonite, and should be avoided at all costs.
Sunday, February 25, 2007
Strong Sector Stocks Watchlist
Here are some stocks on my watchlist. All of these stocks come from the 20 strongest sectors over the past 10 days. I have not included notes because all of the stocks are extended and in need of a pullback. I'm looking for pullbacks to either price support or a major moving average.
RATE, PAAS, SSRI, FWLT, ACI, BOOM, FCL, CNX, CCJ, TIE, VCO, RYI, RS, EXPE, AGU, MON,PFCB and BKC.
Sectors represented include metals and minerals mining, oil equipment, internet info providers, silver, construction, restaurants and agricultural chemicals.
RATE, PAAS, SSRI, FWLT, ACI, BOOM, FCL, CNX, CCJ, TIE, VCO, RYI, RS, EXPE, AGU, MON,PFCB and BKC.
Sectors represented include metals and minerals mining, oil equipment, internet info providers, silver, construction, restaurants and agricultural chemicals.
Links (Multimedia verson)
This week's linkfest is made up of videos and sound clips, so make sure to have your volume turned up.
Trading:
Dave Landry market webcasts.
Podcast interview of super trader Charles Kirk of thekirkreport.com.
Interview with chart pattern pro Thomas Bulkowski.
This week in Barrons.
Revealing interview with Cramer on market manipulation.
AlphaTrends on using MACD
Lectures, Speeches and Interviews:
Richard Dawkins on the delusion of god.
Salman Rushie on Islamic extremists.
Warren Buffet is the anti-trader. Here's when he sells.
Malcolm Gladwell (author of Blink) on variability vs. universals.
Physicist David Deutsch on the survival of our species. Fascinating stuff.
Friday, February 23, 2007
Answering Some E-Mails

Here are some off and on topic answers to email questions, minus the questions:
I've read a lot of trading books, most of them not very helpful. I would recommend any of the Thomas Bulkowski chart pattern books, Enhancing Trader Performance by Brett Steenbarger, Master Swing Trader by Alan Farley and the Market Wizard books by Jack D. Schwager.
I spend at least one hour every night going over charts and stock screens. I also spend time reviewing trades and setups, researching trading ideas and reading articles. On average I probably spend three hours a night on trading related work.
I do watch American Idol. It's like watching a train wreck. As bad as I want to look away, I can't. My favorites thus far are the beat boxing white boy, Blake Lewis, and Lakisha Jones. While not a great singer, I think Chris Sligh would do well as a stand up comic. I was bumbed that Paul Kim was cut. I thought he had a great voice during tryouts.
Sorry Anesh, but I can't think of any way to equate American Idol to trading. I was gonna say "survival of the fittest", but Taylor Hicks won last season . . .
Mixed martial arts, better known as Ultimate Fighting, rocks. I'm a huge fan. Anytime there's a big boxing match or UFC fight, there's a party at the Spec's house. March 3rd, Randy Couture will win back the heavyweight belt.
My basketball team is the Minnesota Timberwolves. I disliked Kevin McHale growing up (I was a Lakers fan), and despise him now for pissing away Kevin Garnett's career.
My football team is the 49ers. At 6 years old, back in 1982, I was in Candlestick when Dwight Clark made "the catch". I've been a fan ever since.
I am a liberal. While I'd be happy if any of the major contenders win the party nomination, I will vote for John Edwards. I am excited about his universal health care plan, and love that he's a straight shooter. The way he handled the Iraq question, saying he made a mistake, rather than Hillary's "I was misled" response, was quite impressive. Both are right, but only Edwards takes personal responsibility.
While I'm rooting for Edwards, I'd be happy if Obama or Hillary were in the White House.
De la Hoya will shock the world and defeat Mayweather. BTW, I love that I have some diehard boxing and sports fans as readers. While I can't make Idol and trading parallels, I can make a ton of sports and trading references.
Watchlists are not recommendations to buy a stock. They are just what they sound like, *watch* lists. I don't consider entry unless specific parameters are met.
My favorite indicator is the stochastic. I use 5 days instead of 14 because I trade on a shorter time frame. Many traders make the mistake of using indicators that don't match their own time frames.
My favorite television shows are Lost, Heroes, Monk, Psych, Criminal Minds, Friday Night Lights, Smallville and Bill Maher. They are all extremely well done. I also watch tons of football and basketball. I do not watch CNBC. I sometimes read Cramer on thestreet.com, but never watch his show.
Today's Trades: CENX, STLD, RL and LEH
I've had a busy day at work, so I'll have to detail the trades in more depth tonight. I bought 500 shares of STLD at $40.02, 500 shares of CENX $47.64 and 300 shares of RL at $87.10.
I also got stopped out of my 250 shares of LEH at $81.61 (entry at $82.64) for a loss of $257 (-1.3%) . This may sound crazy, but I'm actually happy about this trade. I originally had my stop placed under the 50 day MA at $80.40, but decided a better spot would be at the "fill the gap" point under $82. My thinking was, if the stock can't hold the gap support level, it will likely tumble. A tenant I try to adhere to when placing stops is that price action support is more important than moving average support.
An emailer asked my why I am placing so many long trades when I am short the Nasdaq. Take a look at my trades closely. I am not making any bets on tech. My longs have come from the commodity, broker (bad move) and retail sectors.
Thursday, February 22, 2007
Ugh!!! For Some Reason I Ignored My Notes
You'd never have guessed that I've had a pretty good week thus far, considering that I looked like a lunatic after reading the notes I made on Monday's watchlist. Here are the three stocks I starred, with the accompanying notations:
PCU: Nice looking breakout with NR7 HTF formation. Enter now under $68.
For some reason, I ignored my notes. The stock is now trading above $72.
EDU: Strength after BO. Good RSI. Buy break of $42 if good volume.
For some reason, I ignored my notes. The stock hit $44 and again has a nice pullback in place.
JOYG: pb 50 MA. Buy NR7 BO above $49.
For some reason, I ignored my notes. The stock broke above $49 and is now at $54.
I can't figure out why I passed on these trades. I don't recall finding anything inherently wrong with these stocks. However, I did make a couple of more speculative trades that payed off (EWZ and AKAM). Nice, but profit is no justification for passing on these near perfect setups. This is something I'm going to have to start working on. Time to dust off the psychology notes . . .
Today's Trades: EWZ and QID
I sold 700 shares of EWZ at $49.74 (entry at $48.44) for a $910 gain (+2.7%). I originally entered this trade as more of a long term swing trade. However, I didn't trust the gap up this morning, since it wasn't on tremendous volume. If I can enter again at support within the next few days, I will. Otherwise, I'm happy with the gain and will move on.
I bought 600 shares of QID at $49.85. QID is a leveraged ETF, which is basically the same as double shorting the Nasdaq ETF. As you can see from the chart below, QID is extremely oversold and at a key support area. The ETF has generally been kind to those who enter at this point, as shown by the arrows on the chart. As you can surmise, I am not confident that the Nasdaq is going to breakout to new highs. However, if it does, this is still a low risk trade. I will place a stop at about $48.85, ensuring that I lose no more than one point if things go bad on this trade.

BTW, I like the pullback in high end retail stocks such as RL, TIF and COH. I'm still not ready to enter, but will be watching closely over the next few days.
Wednesday, February 21, 2007
Today's Trade: EWZ, AKAM and RATE
I sold 500 shares of RATE at $43.44 (entry at $42.53)for a $455 gain (+2.1%).
I sold AKAM at $56.90 (entry at $55.63) for a $508 gain (2.2%).
I bought 700 shares of EWZ at $48.44.
Over the past six months EWZ has been in a solid uptrend with the 20 day MA providing support. There have been a few blips, however the 50 day MA has provided additional support, and the stock has always rebounded well above the 20 day MA. Therefore, my stop will be placed just under the 50 day MA, at $46.20. This is what I call a "trend trade". I am basically ignoring the indicators (RSI looks good but stochastics say overbought) and just following the trend.
I probably could have waited for a slightly deeper pullback, say all the way to the 20 day MA ($47.82). However, when playing a trend with a longer holding time, I don't feel the need to quibble over 50 cents.

Tuesday, February 20, 2007
Strategy: Under the Radar Sectors (Today it's Foreign Utilities)
As I've discussed before, I like to scan the top and bottom ten peforming sectors over a given time period for charts providing nice looking setups. While this is a good method for providing setups, it can also lead to a lot of "whipsaws" or failed setups, since just about everybody is watching these sectors. Therefore, I usually wait for pullbacks, rather than breakouts, when trading these stocks.


Another strategy I employ for finding interesting patterns is looking for sectors and stocks that might be flying under the radar. Instead of focusing on the top ten sectors, I set my sites a little lower, looking at the 11-30 best and worst performing sectors. Here you'll find stocks that have been performing well but haven't been plastered all over the media and blogosphere.
For example, have you heard much about foreign utilities? Surprisingly, this sector came up at the 13th best performing sector on prophet's industry rankings. Take a look at the sector chart:
Three charts made it to my watchlist: CIG, ENI and SBS. Here is CIG's chart. I'll be looking for a breakout above $50 or a pullback in the $47-48 range for entry points.
Can You Say "Buy the Dip"
This charts of the Dow makes it painfully obvious that, over the past six months, dips reaching the mid bollinger band (the 20 day moving average) are to be bought. I will probably become very aggressive once we pullback again, possibly using a leveraged ETF such as DDM.


Sunday, February 18, 2007
Weekend Links
Trading Links:
Low risk buy opportunity in SPX.
Ed Seykota on trends.
Linda Raschke's random thoughts.
This week's best of Jim Cramer.
I like using moving average crossovers when trading on longer time frames.
Test your trading ideas.
I like buying pullbacks, especially into multiple support areas.
Trading is a game.
Psychology Links:
Reaching your subconscious mind.
Using Zen and the beginner's mind to create beginner's luck.
Positive thinking for positive results.
Sports:
A recount of one of the greatest NBA All Star games ever played (1987).
Vegas Baby!
Let the NFL mock drafts begin.
Peter King's Monday Morning Quarterback.
Music:
Hilarious Grammy recap.
Listen to Norah Jones.
Listen to Crowded House.
Friday, February 16, 2007
Trade: LEH
I bought 250 shares of LEH at $82.64. This is a speculative play along the lines of the AKAM trade. My target is the recent highs at $86, and my stop will be placed just under the 50 day moving average, around $80. The brokers have been strong over the past few months with dips providing good entry points.

Thursday, February 15, 2007
Today's Trades: RATE and AKS
I bought 500 shares of RATE at $42.53. The stock spiked up over resistance on strong volume and has now pulled back on diminished volume, printing an ideal NR7 entry.

I bought 500 shares of AKS at $22.08. As you guys know, I love steel right now. I picked AKS from last night's watchlist after the strong volume break above $22, which has been a minor resistance point over the past few weeks.

I bought 500 shares of AKS at $22.08. As you guys know, I love steel right now. I picked AKS from last night's watchlist after the strong volume break above $22, which has been a minor resistance point over the past few weeks.
Wednesday, February 14, 2007
Thursday's Watchlist
Here are a few stocks high on my list or Thursday. They are all long setups and my buy condition is noted next to the stock
AGU: pullback candidate
RIO: pullback candidate
STP: pullback candidate
OMG: breakout 52
PCU: pullback candidate
CCOI: NR7, use tight stop
TTWO: pullback candidate
Railroad stocks look very attractive. These are my favorites:
CSX: pullback candidate
KSU: ditto
TRN: ditto
I still love the steel sector.
MT: pullback candidate
STLD: pullback candidate
AKS: ditto
X: ditto
I see some short setups in the homebuilder sector, but I've been burned by this sector so many times . . .I'm gun shy right now.
A Quick Note Before the Open
I will be looking for weakness in steel stocks to re-enter STLD or possibly a different steel stock.
Tuesday, February 13, 2007
Today's Trades: STLD and AKAM
I sold all 900 shares of STLD at an average price of $39.88 for a $1577 gain (entries at $37.87 and $38.45). Currently we've got a long bar heading right into resistance at $40. This is a strong stock, and steel has been on fire, so I may re-enter on a break of $40 or pullback to the bottom of the price bar.


I bought 400 shares of AKAM at $55.63. This is more of a speculative play as it does not fit any of the technical entries I normally use. Every once in a while I allow myself a trade like this one, as long as I stick to my stops. The stock has generally fought off the bears and continued higher after pullbacks. It's sitting right at the 20 day MA. My stop will be placed under the 50 day moving average, probably at $53.90.
Monday, February 12, 2007
The Greatest Round in Heavyweight Boxing History
After doing my nightly sector review and preparing my watchlist, I decided I would fall asleep to Sportscenter. Being the boxing junkie that I am, I was happy to see that a replay of the final fight of the classic Evander Holyfield-Riddick Bowe trilogy was playing. Has their ever been a fighter with more heart, guts and determination than Holyfield? He is the only fighter, besides Hearns, who could gain more respect after a loss than most do after wins.
Well, I've wasted the past two hours watching clips of old boxing matches on the greatest gift to sports fanatics everywhere, youtube. Here is a clip of the 10th round of the second Holyfield-Bowe fight, arguable the greatest round in the history of heavyweight boxing. We're talking about two warriors that gave every fiber of their being and, as the cliche goes, laid it all on the line. This is the type of stuff that inspires me.
Well, I've wasted the past two hours watching clips of old boxing matches on the greatest gift to sports fanatics everywhere, youtube. Here is a clip of the 10th round of the second Holyfield-Bowe fight, arguable the greatest round in the history of heavyweight boxing. We're talking about two warriors that gave every fiber of their being and, as the cliche goes, laid it all on the line. This is the type of stuff that inspires me.
Mining Companies Getting Top Heavy?
It may be time to pair back on mining companies:
"The chief executives of the world’s three largest mining companies have decided to bow out this year, prompting speculation that they are quitting before the commodities bubble bursts."
The charts of BHP, RTP and AAUK do look top heavy. A break of the 200 day moving averages, along with weak technicals, might signal a good short entry.
Friday, February 09, 2007
Today's Trades: NCTY, CHIC and STLD
I was stopped out of the remaining 250 shares of NCTY at $36.15 for no gain. The total gain on the 500 share trade was $275.

I bought 500 more shares of STLD at $37.87. I am currently in for 1000 shares of the stock, with the other 500 shares entered in at $38.45. I like the orderly pullback, and have a stop placed around $36.
I went short 400 shares of CHIC at $30.30. This stock caught my eye as a potential short when it broke down late January. I like the "bearish flag" pattern and failure to mount the 50 day MA.
I will most likely place a stop just above the 50 day MA, at about $31.15.
Thursday, February 08, 2007
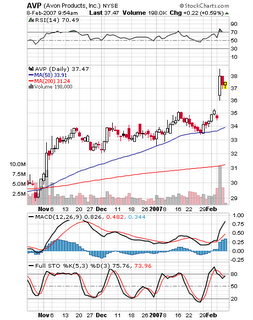
Breakout Chart: AVP
AVP broke out on heavy volume out of a 3 month consilidation. This is what Alan Farley would call a "power spike". Over the next few days, I'll be watching closely for a good entry point. Being that it's Avon, I'm getting some pressure from my wife to enter this stock. She's already happy that I'm holding NCTY.
Wednesday, February 07, 2007
Trade Update: NCTY and STLD
I bought 400 shares of STLD at $38.45. I've been waiting for a nice pullback in this stock, and we've finally got one. Not as far as I'd like, but we're dealing with a very hot sector, so I was willing to enter with more downside risk than normal. Since I don't know how far it will pullback, I may set a wider stop than normal.

I sold half my position in NCTY at $37.25 (entry at $36.15 yesterday) for a $275 gain. For the remaining 250 shares, I've moved my stop up to lock in the gain and let the rest ride.
Tuesday, February 06, 2007
Today's Trade: NCTY
I bought 500 shares of NCTY at $36.15. This stock was originally on my "breakout" list, with $38 as the potential entry point. However, upon further review, I decided that it would make an even better pullback entry. Note that the stock has been a buy whenever it pulls back to the middle bollinger band (20 day MA). I also like the fact that RSI has been strong and a pullback buy, and oversold stochastic crossovers have been successful as entry points. These are all signs of a strong, trending stock. While the stock has not completely pulled back the the 20 day moving average ($35.51), I decided to enter now because the $36 level was the most recent breakout point and we've already had the oversold stochastic crossover. My stop will be placed just under the 20 day MA, probably around $35.25.

I am an AGLOCO member!

I am an AGLOCO member!
Monday, February 05, 2007
Think About Your Idol For Peak Performance
A trick I've used throughout my life to ensure peak performance is to think about an idol, expert or somebody I respect when I am involved in an action. Most of us do our best when we are being watched by another person, especially if that person is an expert in the field. Once that person leaves, we may slack off. For example, I don't brush my teeth the way that I should; I usually just go through the motions and do a half assed job. However, when I'm at the dentist's office and they ask to see how I brush my teeth, I morph into a professional toothbrusher. We can't always have an "expert" by our side, but we can mentally create a situation that will get us motivated to do our best. Now when I brush my teeth, I imagine that my dentist is right next to me.
What's this got to do with trading? Alot. Whenever I place a trade, I imagine a top trader standing beside me watching me place the trade. It might be an all time great like Jesse Livermore. If I'm about to make a trade, and I can hear Jesse laughing at me, I know I better hold off and do some more research.
AGLOCO
Agloco pays you to surf the net! It's a great concept, and as you can see, I'm in. I highly recommend that you join.
Chart: NVL
NVL is setting up nicely with a high, tight flag after a breakout. An aggressive trader could enter now using a stop just under the flag formation, but I will likely wait for a breakout over $38 on high volume.

***AGLOCO pays you to surf the net! It's a great concept, and as you can see, I'm in. I highly recommend that you join.***

***AGLOCO pays you to surf the net! It's a great concept, and as you can see, I'm in. I highly recommend that you join.***
Sunday, February 04, 2007
Here's how a stock can make it to my watchlist: sector analysis
The most frequently asked question I receive is some variation of how I find the stocks that make it to my watchlist. My senses tell me that most of those asking these questions expect that I have some magic formula I plug in that spits out stocks that fit the setups I trade. While I know many traders that do use very specific scans to find stocks to trade, I use a much different approach. I look at charts. Lots of charts. Probably too many charts. At the least, I probably look at over 100 charts a night. Most nights, it's a lot more than that.
That's not to say I go to a list of stocks, start at AA and work my way to ZZ. I use a variety of resources to view charts that are likely to yield setups that I like to trade. As I've mentioned before, one of my favorites is prophet.net's Industry Ranking. I'll guide you through my process by showing you how X (United Steel) made it to my watchlist.
I start off by pulling up the top 10 sectors over a given period of time. In this case, I'm looking at the strongest sectors over the past 15 days.

Metals Fabrication has been the best performing sector over the past 15 days, so I start with charts from this sector. Only four of the 12 stocks in this sector show up because of the filter controls I set (average volume above 300,000 and stocks must be above $10).

After eyeballing these charts, I see that X (United Steel) looks like it may have broke out from a cup and handle. If this is the case, it would make my watchlist as a "cup and handle pullback" setup. Just as it sounds, I go long if the stock successfully tests the new support area (other criteria, such as volume, also need to be met).

Upon closer review, the stock has broken out of a cup and handle and looks strong technically, making it a good pullback candidate. I'll keep a close eye on this stock and do some further analysis. For example, I'll check to see how this stock and sector historically handles cup and handle breakouts.
I repeat this exercise for the remaining top 10-20 sectors. I then do the same thing for the bottom 10-20 sectors, looking for short setups. Once completed, I will have viewed 50-100 charts. I then move on to other sources for watchlist candidates. Some of these include: high volume stocks, 52 week highs, the usual momentum stocks I track and other blogs.
I could go a different route and just have a filter spit out stocks I need for my setups, but I don't think I could be successful using that method. Viewing all these charts gives me a good feel for the market. I have a good idea of where money is flowing and I can see patterns emerging that I might not otherwise catch.
{View homepage}
Saturday, February 03, 2007
Wall Street and Chicago Bears
I like to revisit this clip whenever economic signs point to a market downturn, but Mr. Market keeps on chugging along. This is when da bears really get crushed, and it usually lasts longer than expected, as bears keep on covering their bets. Today's installment has special meaning, as those Chicago Bears are likely to get crushed as well!
A blast from the past . . .the '85 Bears do the Superbowl Shuffle. I took Walter Payton's poster off my wall after viewing this . . .
A blast from the past . . .the '85 Bears do the Superbowl Shuffle. I took Walter Payton's poster off my wall after viewing this . . .
Friday, February 02, 2007
Weekend Links
Trading
How to play Google's bearish engulfing pattern.
Spotlight on TELCO's.
February's bearish implications.
Farley's profile of profitable trading.
YAHOO's chart, and more.
Indice divergence.
What happens after four days of strength?
Sports
Favre is back for another year.
The funniest man writing about sports, Bill Simmons, spends a day on South Beach.
Simmons at the Super Bowl's Media Day Gallery.
Does Peyton Manning's legacy depend on the Super Bowl?
Peter King's odds for Hall of Fame finalists.
Psychology/Self Help
Understanding human relationships.
Are health studies worthless?
Motivational quotes.
The brain points to a "sixth sense".
Trades: USO, RIO and EWZ
I had internet problems yesterday and was not able to post the following trades:
I sold 400 shares of RIO at $34.25 (entry at $32.25) for an $800 gain (+6.2%).
I sold 500 shares of EWZ at $48.00 (entry at $46.10) for a $950 gain (+4.1%).
I sold 500 shares of USO at $48.10 (entry at $46.80) for a $650 gain (+2.7%).
I still like all three of these stocks, and the corresponding sectors, but all three are a bit extended. If I see a nice pullback to support levels, I may re-enter. I know this may be a case of overtrading, but the fact that all three are near resistance levels makes it seem at least somewhat prudent to take my profits.
I am still holding CAL (short) and BLUD (long).
Subscribe to:
Posts (Atom)