I don't trust today's strength, and may use the last hour of trading to initiate some small short positions. The reason for my distrust is twofold.
I believe the market is overreacting to comments from Bush that do little to address the subprime problem. Unless he is willing to provide federal aid to subprime borrowers, the problem will get worse. El Presidente has pretty much laughed off the idea of helping this group. Greedy, irresponsible corporations and hedge funds get bailed out of their mistakes, while the hard working Americans they preyed upon don't. As my man John Lennon would likely say, the "working class hero" doesn't get shit from this prez.
Off the soapbox and on to the second point. The market historically does well today, and the move is on low volume. What this says to me is that today's bounce is a meaningless victory for the bulls.
I still like the momentum stocks on my watchlist. However, I'll look for better entry points.Stocks such as GRMN, NOV, CROX and FLR, to name a few. Most momentum plays are bouncing right into resistance, and that's not where I like to enter.
I'm going to spend my research time this weekend focusing on tech stocks. That's where the money seems to be flowing, so we may see the beginning of a new tech trend. I want to be properly positioned when it's time to jump on the tech train.
Friday, August 31, 2007
Chart: TOL
As noted in the previous post, I took a position in TOL today. Those familiar with my trading style know I don't tend to buy downtrending stocks. However, I noticed some mean looking divergences that lead me to believe their might be some institutional buying at the current levels. At the least, I'd expect a small bounce that's good for 2 points.
Take a look at the vertical box I placed on the chart. This area highlights the bottoming formation. Note that both RSI and OBV show positive divergence. Now compare volume in the vertical box to that in the horizontal box that highlights volume from March to July. Notice that during the downtrend, volume was typically higher on down days than up days. Now we are seeing the opposite volume trend. Volume is higher on up days.
While I've made a pretty good short term bullish argument, it's still tough trying to pick a bottom. The fact that we are talking about the housing sector, where negative news can come on a moments notice, only increases the degree of difficulty.
The great thing about this trade is we have a clear support zone at $20. If this zone is pierced, we'll likely see another leg down. By placing a stop under $20, I am only risking a little over $1.00. My target is the 50 day moving average, which makes my potential gain almost $3.00. This gives me an acceptable 3:1 reward to risk ratio.

Thursday, August 30, 2007
Trades and Watchlist
Trades (posted in comments this morning):
I sold 500 FLR at $123.89 (entry at $120.20) for a $1845 gain (+3.4%).
I bought 400 TOL at $21.11.
I am short 400 shares NUE at $52.56.
I bought 400 shares of SDS (2X short S&P 500) at $55.80.
I will detail the trades tonight.
Here is today's primary watchlist:
Long: NHWK, UA, CROX, CEDC, OMTR, OII, MENT, BIG, SBUX
Short: VSEC, CHE, CTV, RS, SGR, SKF , SRS, LEH, BA
Update: Note that ETFs that short the index (such as SKF, SRS, QID and SDS) are placed in the short list, although they must be bought, not sold.
Wednesday, August 29, 2007
Why Running Away Never Won Glory or a Fight
Fight with valor,
and with a sense of shame before your comrades.
You are less likely to be killed with a sense of shame.
Running away never won glory or a fight
Homer, The Iliad
Lately I've been hearing a lot of traders say it's a "good time to pull out of the market" or it's "time to take a vacation". I think this is nonsense; a cowardly approach to running from a fight that could make you a lot of money.
A scared market is the best place to use your edge. Fear takes over rational thinking and many market players, even the best of them, trade irrationally. That's where the cold blooded rational player can pounce.
Think about how easy this "scared" market has been to trade, as long as you did not get too emotional. It's come down to this:
1. Short real estate, financials and indice ETFs as they bounce towards resistance
2. Buy the outperforming momentum stocks on weakness and strong breakouts.
3. If you are more risk averse, short overbought momentum stocks and buy oversold dogs.
It's been patently obvious that that this simple strategy has been the way to go. Yet many have traded scared, allowing fear to take over rational though. If you can't control this emotion, then by all means, take a break. However, if you can keep your adrenal glands in check and trade with your mind, this is the absolute best time to trade.
{Note that I am not saying a trader should throw caution to the wind. In this type of market, you have to honor your stops and only trade strategies that are intimately familiar to you. I also would not advise trading if you are a beginner, have not researched your proposed stategies or have not shown an ability to make money in the markets.}
Today's Trade: FLR
I bought 500 shares of FLR at $120.20. The stock has been on my primary watchlist since the July breakout and has been a great trend pullback trade. I recently set an entry of $117-120, and the stocked dipped down to $119 yesterday. However, I decided to take a wait an see approach because of yesterdays overall market weakness and uptick in negative volume. Today's strength quashed my fears, and I was willing to buy a little above my entry range.
Along with price support, RSI is at a strong support level (50). I also like the fact that stochastics and OBV have made higher highs.
My initial target is $125, with a stop under the 50 day moving average, at $116.

Along with price support, RSI is at a strong support level (50). I also like the fact that stochastics and OBV have made higher highs.
My initial target is $125, with a stop under the 50 day moving average, at $116.

Tuesday, August 28, 2007
Today's Trades: GRMN, LEH and QID
I know I will receive alot of questions asking why I didn't stick with my short positions longer. While I do feel like the market has more room to the downside, I don't trust pre-holiday trading for sustained moves. Therefore, I feel it's best to take my profits with shorter term trades and look for the next opportunity.
I covered 500 LEH (short at $58.85) when it hit my target at $55 for a $1925 gain (7.1%).
I covered 100 GRMN (short at 102.65) at $97.80 for a $485 gain (+4.8%).
I sold 500 SDS, which is a leveraged short S&P 500 ETF (entry at $54.75), at $56.79 for a $1020 gain (+3.8%).
I am still holding GMCR, LFC and SDS.
I am currently in the midst of one of my best trading runs. Since August 6th, I have made 16 winning trades with only one loser, with $20,861 in total profits. Note that two of the three positions that I am still holding would count as losses if I exited today. I will continue to hold until my stops are hit.
This certainly was not a bad month for an account under $100,000 (I use margin when needed). However, this weekend I will analyze all of my trades, and watchlists, to see what I could have done better. I am still a little ticked about missing the BCSI and CROX moves, two stocks at the top of my primary watchlist.
Monday, August 27, 2007
Today's Trades: LFC and SDS
Missing the moves in BCSI and CROX this past week allowed me to come to a conclusion about current market conditions: the small list of realy strong momentum stocks are not pulling back much in this market. My best guess as to the reasoning for this phenomena is that there aren't a lot of high flyers right now, so the few that do exist are getting bought up quickly by the momentum crowd.
Based on this analysis, I decided to enter LFC early on today's breakout. The stock. along with a few other Chinese stocks, was on my primary watchlist last week at a breakout-pullback play. Normally, I would wait for a pullback into the $65-66 range, but did not hesitate this morning to buy on the opening gap.
I bought 600 shares of LFC at $70.68 and sold half of my position at $74.80 for a $1236 gain (+5.8%). I am still holding 300 shares.
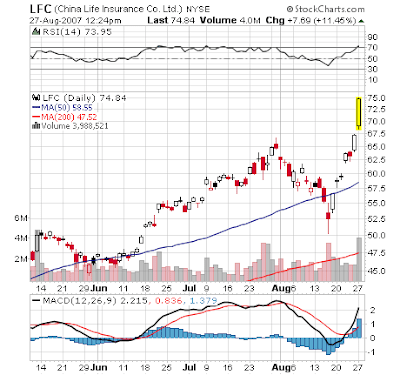
I also bought 500 shares of SDS (leveraged short S&P 500) at $54.75.
Sunday, August 26, 2007
Two Stocks to Watch: FLR and HOC
It's tough to guess which way the market will go this week, so I won't make any big bets in either direction. While the bulls did a fine job in terms of price action, what we had was a "V-ish" move toward resistance on light volume. That's not bullish.
So you're probably thinking I'm going to say it's time to short. Well, it's not that easy. The light volume could just be the pre-holiday effect, with Labor day right around the corner.
I'll probably hedge and play a few shorts and a few longs. Here are two of my favorites; one long and one short:
FLR:

HOC:

Saturday, August 25, 2007
Eleven Articles that Educated or Entertained Me
Here are eleven articles that either educated or entertained me:
Chris Perruna makes the case for the best home-builder stock (Stocks).
Organize by urgency vs importance (Time Management).
The Sports Guy is always an entertaining read (Sports/Comedy).
James Brown being crazy on the news (Entertainment/Comedy).
Mark Cuban on Metcalfe's Law (Technology).
What Bill Maher did on his summer vacation (Politics/Comedy).
Dubya is desperate (Politics).
Learn about string theory. (Science).
Carl Sagan on time tavel (Science).
Randy Couture's ultimate fighting journey (Sports).
Is anti-bacterial soap a fraud (Consumer/Health)
Friday, August 24, 2007
Chart: IDXX
Last night I was scanning sectors that had outperfomed the market over the past month. Number one on the list was Diagnostics, a sub-industry in the Healthcare sector.
A stock that caught my eye that had not been showing up on my nightly scans and focus lists was IDXX. Most of my scans use a volume cutoff, and IDXX is not a high volume stock. However, the stock is showing signs of accumulation.
The stock looks to be consolidating it's gains before making it's next move. I may take a small "probing" position here at $107, with a stop under recent congestion at $103.

Thursday, August 23, 2007
Shorting Momentum Stocks: the GRMN Trade

Those of you familiar with my trading style know I rarely short high flying stocks. While it seems logical to go against a stock that is overextended, this type of trade generally takes on too much risk. Stocks tend to trend longer than they "should" due to market psychology and short squeezes.
However, there is one contrarian setup that I do use on momentum stocks. A stock that reaches it's high, without RSI and OBV confirming the move, gets my attention as a short play.
Take a look at the GRMN chart. During the last high, OBV and RSI levels were higher than they are now. This "negative divergence" is a sign that the stock is not ready to rocket to new highs.
A negative divergence is not enough to jump in. We also need to see a failure at the old high level. We've got that here with GRMN. The stock stopped right at $105 and has pulled back.
The last piece of the puzzle is volume. Volume patterns in this stock are not bullish. We've seen more volume on the downside than upside. This was enough to get me in as a short today.
I went short 100 shares of GRMN at $102.65.
Note that I am not making a big bet here. I took a small position and my stop is above the old high at $105.50. I am risking less than $300. It's never a good idea to make big bets against the trend.
Wednesday, August 22, 2007
Trades: UA, CROX, NOV, GRMN, STLD, GMRC, LEH, SDS
As noted in yesterday's post and comments, I took positions early in the day yesterday and exited early today. While I am still very bullish on the 4 stocks I bought, today's strength was not confirmed by volume, and all of the stocks are nearing resitance levels. Therefore, I decided to exit on strength. I could very well enter again on weakness.
I still think STLD is a good short candidate, but had to stick with my tight stop, as the stock bounced above the moving average.
I bought 500 shares of UA at $66.25 and sold at $68.73 for a $1240 gain (+3.7%).
I bought 500 shares of CROX at $56.15 and sold at $59.20 for a $1525 gain (+5.4%).
I bought 300 shares of NOV at $109.67 and sold at $113.10 for a $1029 gain (+3.1%).
I bought 200 shares of GRMN at $100.10 and sold at $103.70 for a $720 gain (+3.5%).
I covered my STLD short at $40.10 (entry at $39.05) for a $525 loss (-2.6%).
I went long 500 shares of GMRC today at $35.05.
I am still holding my LEH (short) and SDS (leveraged short) postions.
SGR Lookin' Like a Dead Cat
Shaw Group Inc. (SGR) is a former high flying stock that seems to have lost its mojo. In July, the stock gapped up after a long uptrend, but could not hold the gap level. It now looks like the gap was an "exhaustion gap", which usually comes at the end of an uptrend and signals a downswing.
SGR is in the midst of what could be a "dead cat bounce." As a short play, I like the fact that the bounce towards the 50 day moving average has been on low volume. Take a look at the recent volume pattern I highlighted on the chart; lots of high volume down days sprinkled with a few low volume up days. This is a bearish volume pattern.
This is a great short play that I wish I had entered at the close today. If I see price strength on weak volume, I will likely give it a go tomorrow (as long as price does not cross the 50 day moving average without moving back down).

Tuesday, August 21, 2007
Today's Trades: GRMN, UA, CROX, NOV LEH, STLD AND SDS
A quick note that today I went long GRMN, UA, CROX, NOV
I am short LEH and STLD. I also initiated a position in SDS, which is a leveraged ETF short the S&P .
I'm off to a meeting and hope to post more detailed info shortly.
I am short LEH and STLD. I also initiated a position in SDS, which is a leveraged ETF short the S&P .
I'm off to a meeting and hope to post more detailed info shortly.
Monday, August 20, 2007
Stock From the Watchlist: BCSI
BCSI has been a big winner over the past six months. Let's take a look at the chart:

The Good:
Strong trend; breakout over resistance; accumulation, strong obv
The Bad:
Breakout not on above average volume; negative RSI divergence (RSI lower on breakout than previous high)
The Verdict:
I wouldn't be suprised to see a failed breakout here, so I'd be hesitant to enter on a pullback to the breakout point. However, a pullback to the 50 day moving average would provide a low risk entry.
My Narrowed Focus List
With the market giving conflicting signals, I've substantially narrowed my primary watchlists. Here is my current list, exactly as it appears in my notes:
Potential Longs:
OMTR, NVDA, CMG, UA, NOV, GMCR, BCSI, GRMN, DNR, OII, LVS, CROX, WYNN, PCLN.
Stocks of interest, but need a "tell" for direction:
EWZ, VLO, TOT, AAPL, CAT, MA, RIMM, BIDU, POT, EWO
Potential Shorts:
Metals, specifically steel on a weak bounce.
Housing on a weak bounce
Financials on a weak bounce
Indexes, using leveraged short ETFs, DXD, QID or SDS
Sunday, August 19, 2007
The Housing Stock Conundrum: Analyzing TOL
Housing stocks have made a windfall for those bright minded speculators who have traded the obvious short entry signals over the past year (I am not in that prestigious group). While the trend is still negative, there are signs that we may see a bottom forming. Today I analyze Toll Brothers, one of the "go to" housing plays that has been on my short watchlist for what seems like ages.
First, let's dissect the weekly chart:

The first thing I always take note of is the major support and resistance levels. Here, we see support where the bottom seems to be forming, in the $22 range. Overhead resistance is in the $27-28 range. If I were to play the bounce, I would buy right now at support, and sell once the stock nears resistance. Also take note of the RSI and stochastic ranges. I would not buy at the top of the range.
Now let's move to the daily chart:
 The first thing I notice on the daily chart is the "double bottom" that looks to be forming. Accompanying the double bottom is a positive volume pattern showing strong buying. This type of volume behavior is a must for buying a bottom.
While the double bottom pattern is a positive, TOL is a tough buy with the 50 day moving average looming under 2 points away. I would probably wait for a breakout over the moving average, with a target of $27-28.
It is clear that, in the near term, I am looking to play the long side of this stock. If I play the short side, it will only be on strength, using either the 50 day or price-by volume ranges as resistance. I will not short the current level.
First, let's dissect the weekly chart:

The first thing I always take note of is the major support and resistance levels. Here, we see support where the bottom seems to be forming, in the $22 range. Overhead resistance is in the $27-28 range. If I were to play the bounce, I would buy right now at support, and sell once the stock nears resistance. Also take note of the RSI and stochastic ranges. I would not buy at the top of the range.
Now let's move to the daily chart:
 The first thing I notice on the daily chart is the "double bottom" that looks to be forming. Accompanying the double bottom is a positive volume pattern showing strong buying. This type of volume behavior is a must for buying a bottom.
 While the double bottom pattern is a positive, TOL is a tough buy with the 50 day moving average looming under 2 points away. I would probably wait for a breakout over the moving average, with a target of $27-28.
It is clear that, in the near term, I am looking to play the long side of this stock. If I play the short side, it will only be on strength, using either the 50 day or price-by volume ranges as resistance. I will not short the current level.
Friday, August 17, 2007
The "Throw Up" Trade Produces My Greatest Trading Day
When things were at there worst yesterday, besided feeling like throwing up, I felt the markets were extremely oversold and ready for a bounce. I entered seven short term positions which I sold into today's strength (please note that I posted tickers of my entries yesterday). The only thing that links these positions is that they were momentum leaders that had become extremely oversold.
When I say extremely oversold, I'm talking oversold levels that hadn't been seen in months or even years. Even in bear markets, when oversold levels reach these extremes, it's a good bet to position for a bounce. While this bounce could last longer, I'm content in taking my profits and waiting for the market to show it's hand.
I bought 250 shares of AAPL at $113.55 and exited at $121.80 for a $2075 gain (+7.3%).
I bought 150 shares of BIDU at $164.30 and exited at 178.84 for a $2181 gain (+8.7%).
I bought 300 shares of ZEUS at $22.26 and exited at $24.10 for a $552 gain (+8.2%).
I bought 300 shares of RIO at $34.83 and exited at $39.95 for a $1536 gain (+14.7%).
I bought 200 shares of LEH at $51.15 and exited at $58.41 for a $1452 gain (+14.1%).
I bought 200 shares of NOV at $102 and exited at $109.29 for a $1458 gain (+7.1%).
I bought 200 shres of CROX at $45.50 and exited at $50.60 for a $1020 gain (+11.2%).
Total gains (not including commissions): $10,274.
This is the best trading day I have ever experienced. I was feeling great about myself after I exited all of my positions, but upon further reflection, I probably should not have gone "all in." When I say "all in", I mean all in. I was trading on margin, so my $10,000 in gains could easily have been $10,000 in losses, had I been wrong. I usually am very good at position sizing and controlling my emotions. However, yesterday I felt like it was one of those days that only comes along once in a great while, and I wanted to take advantage of it. In my trading journal, I noted that today's gains were a combination of "good market intuition and luck." For the sake of my future trades, I hope there was more of the former.
Over the weekend I hope to provide charts and analysis of today's trades.
Thursday, August 16, 2007
If You Feel Like Throwing up, Go Against Your Better Judgment
I subscribe to the theory that when things are at their worst, when you have that knot in your stomach that makes you want to throw up, and you feel like there's nothing but gloom ahead, that is the time to do the opposite of what your emotions are telling you to do.
I call this the George Costanza Opposite approach to trading. Pay attention, this is some of the technical stuff I have ever posted here.
George one day realized that every decision he had ever made in his entire life had been wrong. So he decided that when he had a strong instinct to do something, he would do the opposite. No surprise, the decisions that went against his better judgment turned out to be the right moves.
I only had two positions today, so I had little invested in the market. By the time the Dow was down 300 points, I was stopped out of both positions. However, once I saw the red three hundred flashing before my eyes, I got really nervous. I know, it made no sense, since I was 100 percent cash. Yet there I was, pacing back and forth at my desk. I knew I looked like a fool, so I sat down. That's when I felt the butterflies.
Since I had no positions to exit, I told myself I should sell the market. I felt like I was about to miss the big move. Then I remembered something I had read before. When you just can't take it anymore, that is when a bottom is coming. I immediately went into Zen mode and cleared my mind of all preconceptions. I took a look at some charts and noticed how oversold the market was, so I decided to buy.
I bought ZEUS and RIO, even though the steel sector is on my short watchlist. I bought LEH, AAPL, BIDU, CROX and NOV (I'll post the trades tomorrow). Note that these are very short term plays. I still think the expected bounce might not last, and we could see more to the downside.
Since everybody has analyzed the indexes, I'll refrain from posting the SPY chart. Just remember that a positive hammer stick printed right at support on heavy volume. At the least, this is a sign that we will see a short term bounce.
One last point. It seems that everybody thinks a bounce is coming. CNBC, the Fast Money guys, respected bloggers and even crappy bloggers. This worries me. When everybody thinks the market will zig, that's when it is likely to zag. Maybe this will cause the expected bounce to be short lived. Or maybe I'm just too paranoid.
Distribution is Taking Over
Lately I have advised that market the volatility is just noise within a range and it is too early to make predictions in either direction. Things are becoming clearer now, and the news is not good for bulls.
The SPY (S&P 500 ETF) has broke down below both price and moving average support. What's worse, it has done so on strong volume. Distribution (selling on high volume) is taking over. It's tough to find strong stocks, even in market and momentum leaders.
I am looking for a dead cat bounce in financials, steel and housing. This would provide for ideal short entries.

I am looking for a dead cat bounce in financials, steel and housing. This would provide for ideal short entries.
Wednesday, August 15, 2007
Today's Trades: NOV (and Steel comment)
I bought 300 shares of NOV at $114.35. Buying this stock on pullbacks has become a go to move for me, like Allen Iverson's crossover. This is one of those "keep doing it until it ceases to work" trades, akin to feeding a hot three point shooter. Okay, that's it with the NBA references . . .

Steel is looking ugly as ever, but as I said in last night's post, I'm hesitant to short until we get a bounce to the 200 day moving average.

Steel is looking ugly as ever, but as I said in last night's post, I'm hesitant to short until we get a bounce to the 200 day moving average.
Four Reasons to Sell Steel
The steel sector, which has been one of my favorites over the past year, has undergone a change in character that now puts it on my "short watchlist." Four elements make it an attractive short:
1. Signs of distribution, with high volume down days accompanied by low volume updays.
2. Break of the 200 day moving average, which had previously acted as a loose trendline.
3. Change in character of the stochastic indicator. During the trend, oversold levels were bought up right away, with the indicator spending little time in the bottom half of the chart. Current levels have remained oversold since late July.
4. Breakdowns in sector leaders such as MT, STLD, X and RIO.
A bounce towards the 200 day moving average may provide an opportune time to short stocks within the sector.

Monday, August 13, 2007
Primary Watchlist
The following stocks are on my Primary Watchlist as long setups:
CROX, MOS, WYNN, SWHC, CMG, GME, NOV, BCSI, OII, POT, LVS, UA, GRMN, DRYS, and TBSI
All of these stocks are trend pullback plays that have held up over the past two weeks.

CROX, MOS, WYNN, SWHC, CMG, GME, NOV, BCSI, OII, POT, LVS, UA, GRMN, DRYS, and TBSI
All of these stocks are trend pullback plays that have held up over the past two weeks.

Five Things You Need to Know About the Market
I often get asked by my readers where I think the market is headed. To the surprise of many, I never make a prediction, and quite frankly, am not good at making arbitrary market calls.
However, once I get the correct signals, I have a good feel for when it is time to get heavily bullish or bearish with my positions. This is when I make the most money.
Here are five questions to ask yourself when assessing the market:
My Recent Trades
Homepage
However, once I get the correct signals, I have a good feel for when it is time to get heavily bullish or bearish with my positions. This is when I make the most money.
Here are five questions to ask yourself when assessing the market:
- What are the major support and resistance (S/R) levels?
Marking support and resistance levels is the most fundamental, and powerful tool for traders. When you know where major S/R levels reside, you will be less apt to overreact to volatile, yet insignificant market noise.
Take this past week as an example. Early in the week we had three bullish days that had many pundits and bloggers pounding their fists saying the correction was over. The astute trader who marked the major S/R points knew it was too early to make a prediction. The SPY had not broke out over price support or the 50 day moving average. A few days later many of those same pundits have turned into bears, yet hardly anything has changed. The SPY ended the week right where it began! Until we get a break of the trading range, nothing has been confirmed.
- Is Volume Showing Accumulation or Distribution?
Volume is what makes the market go. You are not going to see a strong trend without accumulation (uptrend with strong volume) or distribution (downtrend with strong volume). Strong accumulation or distribution tells you that there is a strong probability the trend is for real.
The SPY is currently a tough read. While there seems to be distribution, there have also been some high volume up days as well. It will probably take some time to get a legitimate volume signal. It will most likely come when there is an S/R break as well. - Is the Market Confirmed by New Highs/Lows?
When the market makes a move, the ratio of new highs to new lows need to confirm the trend. If there is not confirmation, you must take the roll of a sceptic. Chris Perruna made a great call during the up move early in the week. While the markets were bouncing, more stocks were making new lows compared with new highs. - Is the market confirmed by the ratio of breakouts vs breakdowns?
Similar to the ratio of new highs to lows, I always take note of the breakout versus breakdown ratio. Every night, I screen for trending stocks that are breaking out or down by 3 percent or more on heavy volume. A key here is that I screen trending stocks. These stocks are more likely to show real moves, unlike the meaningless bounces of range bound stocks. - Is the market confirmed by market leaders and momentum stocks?
When you run a daily breakout scan and create a watchlist based on it, you will have a good feel for the market's leaders and in play momentum stocks. A strong market move needs confirmation from the momentum leaders. For example, if the market makes an up move, yet AAPL, BIDU, RIMM, EWZ, ICE, GES, MA, CROX and POT languish, I am skeptical of the move.

My Recent Trades
Homepage
Saturday, August 11, 2007
Trades: AAPL and NOV
I sold 150 shares of AAPL at $125.84 (entry at $121.75) for a $613.50 gain (+3.3%). I noted the exit in the comments section of my last post.
At the close, I sold 200 shares of NOV at $116.11 (entry at $109.64) for a $1294 gain (+6.0%).
Both trades were pullback plays off of extreme weakness. While buying on this type of weakness can be risky, I felt they were low risk, high reward trades. When I bought the stocks, they had fallen right into very strong support areas. If you look at the charts below, you will see that price could not help but to bounce.
Note that these were extremely short term plays. AAPL actually looks like a good short candidate for my normal swing trading style, and is on my primary short watchlist. However, it was obvious the stock was a good long day trade, due to the support level.

NOV is still a good long candidate, as long as the 50 day moving average holds and OBV remains strong.

Friday, August 10, 2007
Trades: MS, AAPL, NOV and CROX
I covered my entire 800 share MS short, half yesterday at $63.05 and half today at my target, $60.10 (average entry price was $65.89). That comes out to a $3455 gain (+6.4%).
I have not unloaded CROX yet, despite currenly being about 5 points down (-$2000). I've decided to use a very loose stop, just under the 50 day moving average. The potential loss is bigger than originally calculated, making for a crummy reward to risk ratio. I rarely make this kind of move, but there is strong support at the new stop level.
I bought 150 shares of AAPL at $121.75. Technically, the stock looks broken. However, take a look at the price by volume bars on the chart. There is a lot of support here, so I expect a bounce.

I bought 200 shares of NOV at $109.64. The stock i still holding at the moving average, and again there is a lot of support at this level.

Thursday, August 09, 2007
Chart: ZUMZ
When the market tumbles, the first thing I do is scan for stocks that performed as if in a bull market. ZUMZ was up over 4 percent today, and broke out over major price resistance on heavy volume.


Market Notes and SPY
Talk about a brutal day. After all the talk of a market comeback yesterday, I was expecting weakness today, but nothing like this. In fact, I was so confident that the morning dip would be the low point, I bought CROX and covered my MS short (I'll post the trades later tonight). Ouch!
Just as talk of a roaring market comeback was premature earlier this week, it's too early to go into full bear-mode. Take a look at this chart of SPY (S&P 500 ETF). While price made a high percentage move to the downside, SPY is still holding the 200 day moving average that it crossed over earlier this week. If you take the "cup half full" approach, that's a good sign. A break of the moving average would have been an obvious short signal.
Volume is a bit more complicated. A bull can say volume is lighter than last week's slide, so all is good. A bear can say volume is heavier than this week's upmove, and he too would be correct. It's a tough call that I am not prepared to make, so I'm going to focus on price action until volume settles itself.
The main point to take away from the chart is we dont' yet know if today was the end of the market bounce. Until we get a break of the 200 day moving average, I would not make any big bearish *market* bets (there are some individual stocks and sectors that are ripe for shorts).

Reader Trade Request
 I've found that the best way to grow as a trader is to observe how others trade. This can be done by reading blogs, sites, books, talking to friends, and if you are a blog author, via communications with your readers. I don't think I could ever quantify how much I have learned from readers of this blog who have sent personal e-mails.
In an effort to bring some fresh perspective, I invite you to send me trades you have recently made. Whether your time frame is minutes, days, weeks or months, I'm interested. All I ask is you send at least two trades, one winner and one loser (you can send more if you like). Please explain why you entered and what your trading strategy for the trade was. Also include any other information you think is important, such as charts, stops, targets, post trade analysis, psychological analysis, sector and market movement, etc.
Send trades to SinghJD1@aol.com. I will post all trades sent in on the site (unless requested not to), with my own commentary on the trade.
Wednesday, August 08, 2007
Primary Watchlist
Here is a list of ten stocks from my primary watchlist:
BOOM, NOV, CROX, UA, DRYS, EWZ, RIO, SNCR, VSEC, IBN

BOOM, NOV, CROX, UA, DRYS, EWZ, RIO, SNCR, VSEC, IBN

Trade: UA
I sold 400 shares of UA at $69.10 (entry at $63.65) for a $2180 gain (+8.56%).

Considering the stock closed at $66.68, I can understand if someone reading this rolls their eyes at what looks to be perfect timing for exit. Please note that I left a comment regarding the exit in the the previous post (I did not have time to create a full post at the time).
I had two reasons for exit. One, the stock was right at my initial target of $69-70. Two, There was not enough volume in the stock or the market to think this was a momentum breakout that would lead to more upside. This is also the reason I added to my MS short.
I still like the stock and it currently resides at the top of my primary watchlist. I will likely enter if we get a little more of a pullback.
Tuesday, August 07, 2007
The Fast Money Guys Versus The Market Speculator

The Fast Money guys are hot on the financial sector, with Guy Adami specifically pointing to Morgan Stanley as a valuation play. I, on the other hand, am bearish on the sector and currently short Morgan Stanley.
There is no way a true technician could enter MS from the long side right now. Take a look at the chart. Price, OBV, RSI and stochastics are all trending down. To make matters worse, the current bounce is still under the 200 day moving average, with the shorter term 50 day moving average pointed downward and looking ready to cross below the 200 day. These are all bearish extremely bearish signals that make the current bounce the perfect shorting opportunity.
Under Armour Entry
Here is the reasoning behind the UA trade trade I made today:

It is startling just how well UA has performed in the midst of the current market conditions. What if UA had reported earnings in a good market environment? This explosive move leads me to believe the stock will fly if and when the market moves higher, so I entered on the pullback off highs early in the day. As I've explained many times before, I am not a stickler for entry points. If I were more patient, I could wait for a pullback to the breakout point, around $61-62. However, I don't want to miss the next leg up, so I'm in at $63.65, which is still a good 3-4 points below the recent high.
On a personal level, it's always fun trading stocks I support. Not only do I wear Under Armour gear when I lift weights, Vernon Davis is featured in their commercials. He's the tight end of my lifelong team, the 49ers. Those of you who play fantasy football, I advise you to draft him as your tight end. I guarantee better success than my MT trade ;)
Today's Trades: MS, UA and NOV
I bought 400 shares of UA at $63.65
I bought 300 shares of NOV at $111.10.
I went short 400 shares of MS at $65.54
I will go into more detail about these trades tonight.


I bought 300 shares of NOV at $111.10.
I went short 400 shares of MS at $65.54
I will go into more detail about these trades tonight.


$SPX Revisited
On Friday I brought up the idea that we *may* have had a capitulation event that marked the end of the current correction. Today's strong move in the $SPX, back over the 200 day moving average on heavy volume, lends more credence to the bull capitulation argument.
There are a couple of things to note before throwing caution to the wind. First, Ben's announcement today could reek havoc on the market and negate any of the forming technicals. Second, even if Friday was a capitulation event, it may take some time to form.
Take a look at the capitulation event that ended the early March correction and preceded the next bull run. While the market did run up slightly after capitulation, it reversed and formed a "double bottom" before heading back to new highs. This is quite common after a big correction. Many nervous bulls will use that first big bounce to get out of the market at a decent price, so it takes some time to breakout over the first resistance. However, once that resistance point clears, there is a lot of money to be made.

Monday, August 06, 2007
Trades: MT, MS, QID, NOV
I cleared out all of my positions that were entered on August 2nd, since they all either hit their targets or stops.
I covered the MS short, 400 shares at $60 (short at $64.20) for a $1680 gain (+6.5%).
I sold 400 QID at $46.55 (entry at $44.88) for a $668 gain (+3.7%).
I sold 100 shares of NOV at 106.84 (entry at 115.10) for an $826 loss (-7.16%).
I sold 400 shares of MT at $62.90 (entry at $64.20) for a 520 loss (-3.25%).
2 wins with average gain of $1174
2 losses with average loss of $673
Total Profit: $1002
Breakouts vs Breakdowns: Capitulation or Disaster?
Every night I scan for stocks breaking out (upward breakout) and breakout down. I mainly screen for stocks with specific price and volume movements, along with additional moving average and momentum screens. Friday had the biggest discrepancy between breakouts and breakdowns that I can remember. Only 26 stocks showed up on the breakout screen, while a whopping 552 showed up on the breakdown screen.
I honestly am not sure what this data is telling me. It could mean that Friday was a market capitulation event, and most of the correction is behind us. On the flip side, it could be a signal that things are really bad and the worst is yet to come. While I'm not willing to make any big bets, I do think a weak bounce here is an opportune time to deploy a few more short plays.
However, I won't get carried away. Take a look at this three year chart of the $SPX. Until I'm shown evidence to the contrary (which my heart and brain tell me I should expect), I will operate under the assumption that I must be ready to cover shorts at a moments notice.

Friday, August 03, 2007
Primary Watchlist Additions: BCSI, SNCR, AKS
I've added 3 new positions to the primary long watchlist: BCSI, SNCR and AKS.
All three stocks have been strong on a week market and have not violated any supports.

All three stocks have been strong on a week market and have not violated any supports.

Trade: MMM
Later in the day I bought 400 shares of MMM at $88.75.
The stock shows no signs of the recent market slide. I know some of you are scratching your heads thinking "it's dropped from $92 to $88." I see that too, and I like it. While many stocks pulled back quickly on heavy volume, 3M did so gradually on light volume, with stronger volume on the up days. This is a bullish pullback to support (price and moving average support are right at $88).
My stop is place a bit under support, with my initial target at the recent high. For those counting, I am now long 3 stocks and short 2. I will likely add short positions if the market bounces on low volume, or violates major support.

Thursday, August 02, 2007
Primary Watchlist (Longs)
Here are the twenty stocks on my primary watchlist for longs:
NVT, CROX, UA, VSEC, DRYS, TBSI, GRMN, KCI, CMG, BOOM, DW, GMCR, NOV, OII, RIO, SBUX, MT, PCZ, TOT, BTJ
NVT, CROX, UA, VSEC, DRYS, TBSI, GRMN, KCI, CMG, BOOM, DW, GMCR, NOV, OII, RIO, SBUX, MT, PCZ, TOT, BTJ
Today's Trades: MT, QID, MS and NOV

Long Trades:
I bought 400 shares of MT at $64.20.
I bought 100 shares of NOV at $115.10.
Short Trades:
I am short 400 shares MS at $65.20
I bought 400 shares of QID at $44.88, which is 2X short the Nasdaq.
Wednesday, August 01, 2007
Another Strong Stock: CROX
One of my loyal readers asked me why I keep spotlighting strong stocks when I am more apt to go short right now. Fair question. The reason is, at the moment, it is easy to find stocks to short. If I were to throw darts at a board with the 7,000 stocks I track, there's probably about a 75 percent chance I'd hit a stock that looks like a good short. It's much tougher to find strong stocks right now.
Why focus on strong stocks? One, it's good to have a hedge when taking alot of short positions. Two, I need to be ready if this dip proves to be a garden variety correction. The stocks that have held up well are likely to skyrocket if the bull market continues.
So here's another strong stock, Crox. Nice breakout that has held up thus far.

Subscribe to:
Posts (Atom)