Yesterday I posted a chart of GS and asked what the chart tells us. GS is showing a clear negative divergence right at resistance. This signals a pullback at resistance, or if the R level does break, a pattern failure post breakout.
Short entry can be made under R, or post breakout. As noted to Trade Report members, I went short yesterday under the R level at $149.12.
Tuesday, June 30, 2009
Monday, June 29, 2009

RIMM Showing Bear Flag and Distribution
RIMM is at the top of my focus list for shorts. Notice the bear flag formation and bear flag that has formed under the 50 day moving average. The volume pattern is also showing distribution, with heavy volume on the recent drop.


Thursday, June 25, 2009
Today's Trades: FCX and MON
I made two speculative trades today, short FCX and long MON.
MON is oversold, but still a few points from support. The higher probability setup is to enter long at $70, which I will do if I get stopped out of this trade.
FCX shows a bearish pattern, but has bounced over the 50 day moving average.
Both trades are low risk, but average probability. Obviously I am using tight stops for these trades.


Wednesday, June 24, 2009
The "Experts" Get it Wrong - Example 1
Complex systems are rarely predictable. For this reason, I focus as much on risk in my trading systems as I do stock picking and setups.
In most disciplines that try to predict the future, the so-called experts aren't much better than a novice. This series highlights this point.
Example 1:
In the 1979 NBA draft, Larry Bird was drafted 6th overall. Considered of the the greatest players in NBA history, he lead the Boston Celtics multiple championships, was a 12 time All Star and helped revitalize the NBA with his rivlary with Magic Johnson.
Many of the experts said he was too slow, could not jump, and his college game would not transfer to the NBA. Only one of the five players selected ahead of him made an all-star team, and none are in the Hall of Fame. Obviously, the experts go this one wrong.


Tuesday, June 23, 2009
Short Setup: AMZN
AMZN has broke down below the 50 day moving average and shows a negative volume pattern. RSI has also broke down. Looking for entry on bounce, which would provide a low risk setup.


Thursday, June 18, 2009
Trade Update: SPY and DIG
As noted to trade report members yesterday I entered SPY at $91.61 and DIG at $28.33.
The SPY trade is based on anticipation of a morning star candle formation completing. Small loss if stopped out. Potential for big gain.
DIG anticipates oversold bounce on test of moving average.

The SPY trade is based on anticipation of a morning star candle formation completing. Small loss if stopped out. Potential for big gain.
DIG anticipates oversold bounce on test of moving average.

Wednesday, June 17, 2009

Tuesday, June 16, 2009

Monday, June 15, 2009
On Time Frames and Over-Trading
Since joining Twitter, I've had a number of conversations with Trade Report members who also use twitter. I've found a common mistake between twitter users, and that is over-trading and not understanding time frames.
Yesterday, a member told me he had entered one of my focus list stocks. I asked him why, since it was not near the entry point that I had suggested. He said somebody that he follows on twitter has suggested that same stock and had taken a position.
The stock is down over $1.50 today and is now near entry level. Meanwhile, the trader report member who entered is down 5 percent on the trade and needs to exit before support levels, or the loss could get too big for his account.
I did a little research on the "tweets" that suggested the stock, and it turns out that the person who suggested the trade is a daytrader. He would have been stopped out of the trade long ago for a minimal loss, and was looking at support levels mean for a daytrader, not swing trader.
The loss the guy on twitter took was perfectly acceptable, but only on his own time frame and trading style. However, the Trade Report member, who traded it as a swing trade, made a major blunder. He traded the stock without a plan and under the wrong time frame.
This is a common mistake amongst traders. Make sure when you follow a recommendation on twitter or anywhere else, that you know the trading style of the person recommending a stock. Then do your *own* analysis and see if the trade fits your trading style, risk and trade management principles.
Another common mistake that is prevalent with twitter users is becoming trigger happy after reading about what other traders are doing. There are a lot of great tools out there (when used properly), but one must stay disciplined and stick to their own, effective trading style.

Friday, June 12, 2009
Exiting Apple Short Trade
I exited the remaining position in the AAPL short trade at $37.44. The stock is now near a decent support area and may be set to bounce. Keep an eye on the bounce. If it's on weak volume, we'll get another good short opportunity via a "dead cat bounce". Right now, the volume pattern is showing strong distribution.


Thursday, June 11, 2009
XBI Chart
Biotech has made a nice run and has pulled back to a nice entry level. I already have a position, with a stop placed under the pivot point.
Stop placement is tricky since the pivot area is near the 50 day moving average, which also provided a good entry. If one has an appetite for taking more risk, the stop can be placed under the moving average.

Stop placement is tricky since the pivot area is near the 50 day moving average, which also provided a good entry. If one has an appetite for taking more risk, the stop can be placed under the moving average.

Wednesday, June 10, 2009
Follow Me On Twitter
I am now going to start posting market thoughts and trades on twitter when I don't have time to post to the site.
See the sidebar to the right.
See the sidebar to the right.
The Apple Short Trade Continues
The AAPL short trade is turning into a textbook example of the overbought and evening star candle setup. So what do we do from here?
Support may be found at the old pivot high, around $135. This would be a good area to exit shorts and possibily enter long.
However, longs should be wary of the distribution pattern that is forming. Take note of the tremendous pick up of volume during this downswing. I would not be surprised to see a small bounce or a retest of the recent high, creating a "double top", followed by a strong down move.
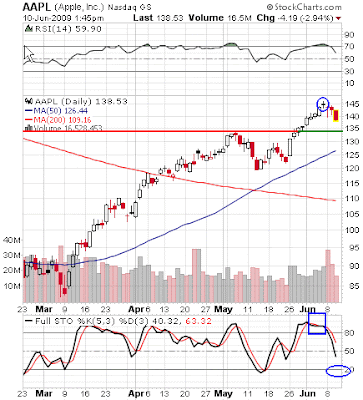

Tuesday, June 09, 2009
Distribution Showing Up In Brazil ETF (EWZ)
EWZ, along with the other BRIC countries, has been on fire of late. However, the recent consolidation has the look of a short term top, with the volume pattern suggesting distribution.
Note the high volume down days during the recent consolidation.

Note the high volume down days during the recent consolidation.

Monday, June 08, 2009
Trade Update: AAPL
I took partial profits in my AAPL trade today. I have moved my stop up to entry and am letting the rest "ride".
Friday, June 05, 2009
More on the Overbought Status of Apple
Last night I talked about the "rubber band" short setup for Apple. If the stock heads into the close with the same candle pattern that has emerged this morning, I would expect a pullback based on an early "evening star" candle formation.
My testing and experience tells me that this type of candle formation is an average predictors at best. However, when coupled with extreme overbought readings it gives a very strong edge.
Note that I am still bullish AAPL. It's just overbought and due for a pullback. An orderly dip to support would make for a great long entry.

Thursday, June 04, 2009
Against the Apple Trend
AAPL is on my bullish watchlish. Why wouldn't it be? It has a great price and volume pattern, and has shows relative strength versus the S&P 500.
However, the stock is very overbought. Every one of the measures I use to find "rubber band" setups is off the charts. I will likely short the next move higher.
This is a countertrend trade that is very short term and managed with a tight stop. Remember, I am long on this stock. The short "rubber band" trade is short term and against the trend.

Wednesday, June 03, 2009
The Low Risk SKF Trade Setup
SKF is slighly bouncing off support lows. Support could break, but the setup still offers a good risk ratio and a trade that is easily managed. Enter as close to support as possible, place stop below support lows, with a target near resistance levels.


Monday, June 01, 2009
The Simple SPY Strategy
My strategy for trading SPY is about as simple as it gets right now: Short strength and buy weakness.
I will look to enter long on a pullback to the 200 day moving average. My "rubber band" short setup triggers on continued strength close to $100.
I will look to enter long on a pullback to the 200 day moving average. My "rubber band" short setup triggers on continued strength close to $100.
Subscribe to:
Posts (Atom)