Charts of FWLT and T, Along with Discussion of Sectors Printing Hammers and Divergences
Many of the beaten down sectors printed hammers (candles with long tails that close near the high of the day). Hammers can signal the reversal of a downtrend, as buyers jump in after the weakest hands have been shaken out, especially if the hammer prints at strong support. The prudent trader will watch the next trading session to make sure a reversal is at hand, rather than blindly jumping in. I'll be watching oil, steel, coal and gold stocks. Some of my favorites that printed hammers include CHK, AAUK, STLD, CMC, and OIS. These are "short term long" setups. Once the stocks near resistance, I will probably be looking to short again.
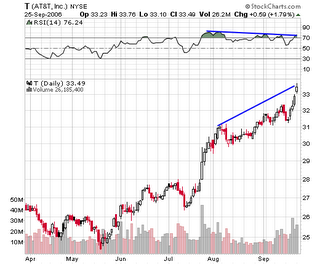
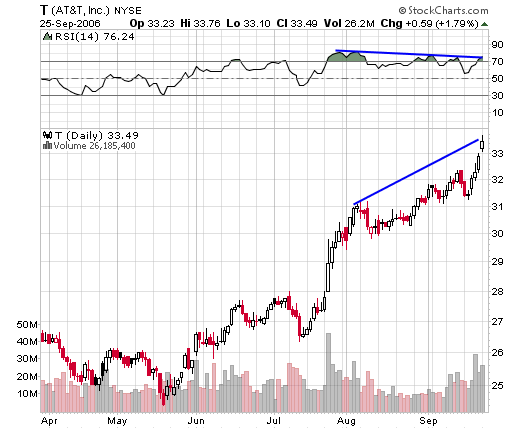
There has been a rotation into big cap stocks, with many at or near 52 week highs. However, I would be weary of entering long, and am licking my chops to go short. Why? Take a look at the RSI on these stocks. Some major divergences are forming, as the stocks reach price highs while RSI falls. T(AT&T, Inc.) exemplifies the chart of many big cap stocks:
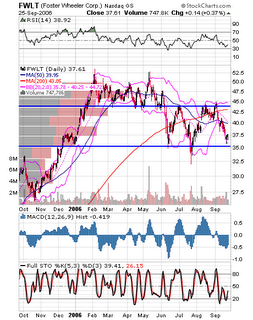
FWLT (Foster Wheeler Corp.) may be bouncing off support. Keep an eye on the support and resistance lines shown in the chart below.

No comments:
Post a Comment