Intellectually my mind is telling me to steer clear of
homebuilders, but how can I ignore the charts? Almost every homebuilder is showing a nice bottoming pattern with a breakout and pullback to support. Take a look at this chart of
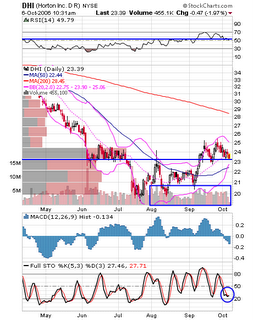
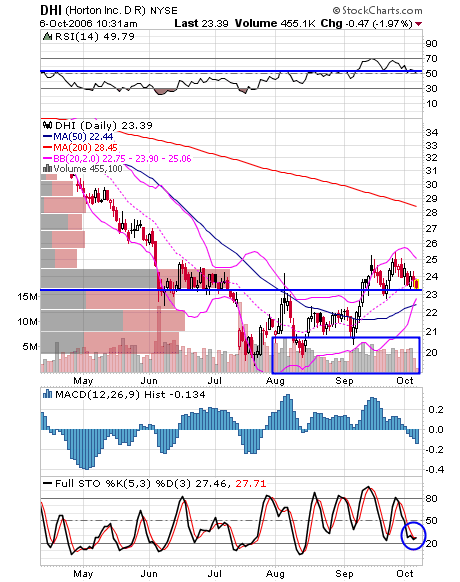
DHI (Horton Inc. D.R.). We have a steep decline, a bottoming base, breakout and pullback to support. On top of that, volume has been ideal, with above average volume on up days and below average volume on down days. This all leads me to believe that the
big guys are slowly accumulating the stock. I have no idea why, as almost all economic data points to a a slowdown. However, we are traders, not economists or even investors. You've gotta go with the flow, and money is flowing into these stocks.
I'll be watching how the stock handles the support line at $23. A bounce might get me to buy for a quick trade, while a breakdown below the 50 day MA would get me in as a short.
2 comments:
DHI trading below longer term trend line back from early jan 2006 and its also trading below very short term trendline...
since the mid summer, i see vol decreasing...
seems like it may want to go down, but this sector too hard to play right now... other stocks seem more "intuitive"
no comment on my other comments? not many other commenters
I agree it could go down, which is why I'm watching $23 very closely.
Post a Comment