Wednesday, November 15, 2006
Chart: AKAM
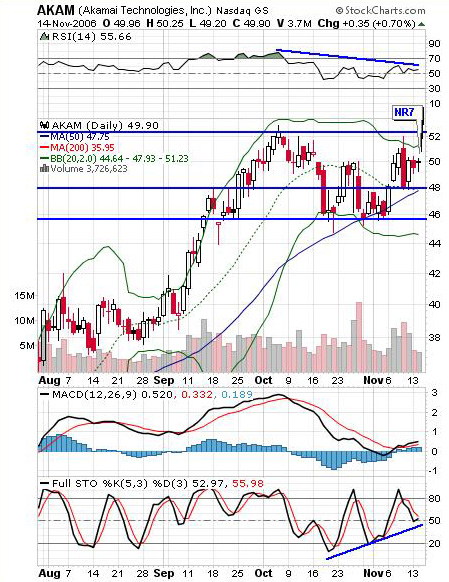
AKAM's (Akamai Technologies, Inc.) chart is giving mixed signals. RSI and Stochastics often move in tandem, but here we have RSI showing a negative divergence, while stochastics show no divergence and bullish looking higher lows. The best way to play this stock is to ignore the indicators and watch three key S/R levels. A breakout over $52 would provide a good bullish entry point at new highs. Bears should watch the 50 day MA at $48, but a better entry point for shorts would likely be a break below $46. AKAM's ascent was so swift that we dont' see strong support until $40. AKAM printed an NR7 today, so expect a move soon.

Subscribe to:
Post Comments (Atom)
2 comments:
Thanks for your open analysis. I enjoyed the NR7 post at trader Mike's site. A stock that has had multiple NR7's is AGN. The stock seems to be in an oversold state floating on its 200dma. What are your thoughts when multiple NR7's occur in circumstances such as this?
Cheers - David
Hi Dave,
Generally, NR7(2) is supposed to be even more powerful than one NR7. I haven't tested this, but I know Alan Farley is a big proponent of multiple NR7s.
Looks like AGN has made the bounce you expected, off an NR7(2). $111-112 is going to be an important are to watch.
Post a Comment