Monday, November 06, 2006
Chart: CENX
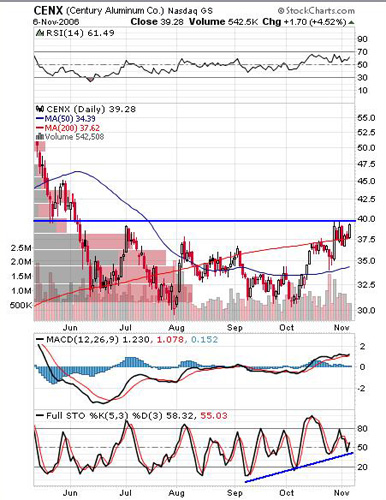
Many stocks in the aluminum sector look like they may have bottomed, and CENX (Century Aluminum Co.) is no exception. The stock has made higher highs in both price, stochastics and RSI, crossed above the 200 day MA, and the 50 day MA is now moving up. CENX is butting up against resistance, so I'm not ready to enter just yet. However, a breakout over $40 would be a good entry point.

Subscribe to:
Post Comments (Atom)
1 comment:
I looked at CENX on a 1 year chart with an EMA 90 and if you would do the same thing you would probably see what happens when it crosses the 90 from below (as it did about 15 days ago). If you then switch to a weekly chart with an EMA 90 I think you would see how CENX uses the EMA 90 as support on a weekly basis.
It looks to me in the absence of any other indicator that CENX is possibly ready now.
But I never buy and hold for more than overnight so what do I know?
Post a Comment