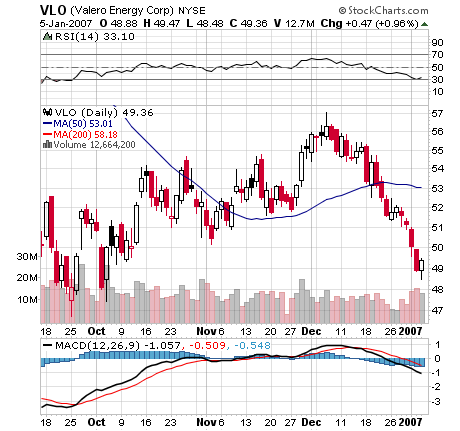
Let's use VLO (Valero Energy Corp.) as an example. The three month time frame doesn't offer many trading clues. There are some weak S/R levels, but I don't see much of a pattern. While VLO is always on my watchlist, based on this chart it would not crack any of my primary lists. The stock does look like it has dropped to an area of strong support, is way oversold and may react with a bounce. If it breaks down at support, we could see a further drop, but I have no idea how much of a drop to expect.
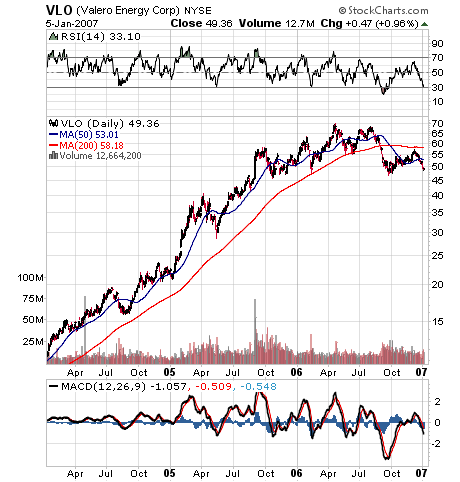
Now lets take a look a longer term chart going back to 2004. Talk about a different perspective! Here, we see the stock had been in a strong uptrend and only recently has begun to falter. In recent months, the 50 day moving average crossed below the 200 day for the first time during this period, which is a bearish sign. We can also see a double top that has been forming since the beginning of 2006, with the breakdown point at around $46. Another wonderful nugget is that the stock has been, at the least, a short term buy everytime it has hit 30 on the RSI.
Although I am not trading on the 3 year time frame, this chart has fleshed out some trading strategies for this stock. I can expect a bounce if the stock hits an RSI reading of 30. I see that a "dead cat bounce" in the longer time frame could reach up to $55-60. A breakdown at $46 will be a signal to enter short off a double top pattern. Once the stock comes close to any of these numbers, I can then switch to a shorter time frame and look for more precise entry points.
These two charts provide a good example of hidden areas of support and resistance that lurk on short term charts. The next time you wonder why a certain stock mysteriously hit a brick wall at some seemingly arbitrary level, change your perspective and take a look at the bigger picture.
{If you linked here from another site, thanks for visiting and please visit the rest of my site.}
No comments:
Post a Comment