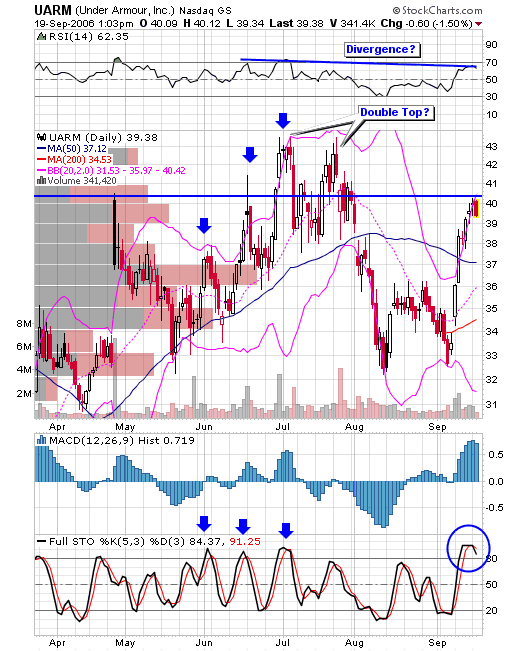
The stock is butting up against resistance, has an extremely oversold stochastic that is pointing down, is inside the upper bollinger band for the first time in 5 days, a lower RSI than the first time it hit $40 and the MACD seems to have peaked. It looks like a big fat topping formation to me. Also note the arrows on the chart. Each time the stock has reached this exteme stochastic level, it has followed with a bearish move down.
No comments:
Post a Comment