Showing posts with label Trade. Show all posts
Showing posts with label Trade. Show all posts
Friday, August 05, 2011
Trade Alert: SPY, AMZN, NFLX and AAPL
I'm finally ready to enter long. The market is very oversold with stochastics dipping under 10. I just entered SPY, AAPL, NFLX and AMZN. I will use tight stops and manage risk closely.


Thursday, December 09, 2010
NFLX Trade
I entered NFLX today at $186.11. Here is what I wrote to trade report members:
My watchlist is rather small right now and there aren't any good entries, so I'm going to take this opportunity to analyze a focus list stock that is not an easy sell as a long or short right now, NFLX.
NFLX has been a 2010 juggernaut momentum stock. It's been the textbook trend pullback trade. In 2010 there have been at least eight good opportunities to enter, and I, along with many of you, have traded the stock successfully. There is another pullback that normally would be a good entry, however there is a key difference in this pullback whencompared to the others---volume.
Take a look at the enclosed chart. Each arrow signifies a pullback buying opportunity that was successful. Notice that the volume pattern in each of these instances shows higher gray bars than red bars. This tells us that the stock was being accumulated. The pullbacks were natural profit taking that occurs in all uptrends.
Now take a look at the current pullback. The red bars are nearly as high as the gray bars, and there are more than one. This is a concern. There are signs of distribution. Now this does not mean the stock is definitely going to fall here. However, it needs to be noted. There is a less of an "edge" to entry here. Many times there will be one more boost higher before a big fall. So keep this in mind. If a major support area breaks, be ready for entry.
Because we focus on risk/reward ratios, it's still okay to enter long. If we take a small loss, that's fine as long as we continually take 2:1 or 3:1 trades. When I see distribution starting to settle in, I like to get closer to 3:1 because the probability of a successful trade decreases.
If entering here, around $185-186, the natural target and stops based on support and resistance would be 179 and 205. That gives us the 3:1 risk reward we need for this setup.
I just entered at $186.11. Remember, you have to be willing to embrace a small loss here. We are looking at long term gain, not the result of one trade or the short term win/loss record.

My watchlist is rather small right now and there aren't any good entries, so I'm going to take this opportunity to analyze a focus list stock that is not an easy sell as a long or short right now, NFLX.
NFLX has been a 2010 juggernaut momentum stock. It's been the textbook trend pullback trade. In 2010 there have been at least eight good opportunities to enter, and I, along with many of you, have traded the stock successfully. There is another pullback that normally would be a good entry, however there is a key difference in this pullback whencompared to the others---volume.
Take a look at the enclosed chart. Each arrow signifies a pullback buying opportunity that was successful. Notice that the volume pattern in each of these instances shows higher gray bars than red bars. This tells us that the stock was being accumulated. The pullbacks were natural profit taking that occurs in all uptrends.
Now take a look at the current pullback. The red bars are nearly as high as the gray bars, and there are more than one. This is a concern. There are signs of distribution. Now this does not mean the stock is definitely going to fall here. However, it needs to be noted. There is a less of an "edge" to entry here. Many times there will be one more boost higher before a big fall. So keep this in mind. If a major support area breaks, be ready for entry.
Because we focus on risk/reward ratios, it's still okay to enter long. If we take a small loss, that's fine as long as we continually take 2:1 or 3:1 trades. When I see distribution starting to settle in, I like to get closer to 3:1 because the probability of a successful trade decreases.
If entering here, around $185-186, the natural target and stops based on support and resistance would be 179 and 205. That gives us the 3:1 risk reward we need for this setup.
I just entered at $186.11. Remember, you have to be willing to embrace a small loss here. We are looking at long term gain, not the result of one trade or the short term win/loss record.

Wednesday, October 13, 2010
Today's Trades: AAPL, DZZ, RIMM, SPY
Here are charts of the trades I made today. Note that I consider the shorts are early "speculative" trades until there is a confirmation candle.
SPY (short)--hitting the bottom of the $118-120 resistance range. Stochastic overbought at 89. Will add more close to $120.

RIMM (long)--breaking ot of triangle after remounting 50 day moving average.

Gold (short via inverse ETF DZZ, using GLD chart to show from long perspective)--extended. much more so than previous runnups.

AAPL (short)-- extended. overbought stochastic at +90 reading. RSI divergence.

SPY (short)--hitting the bottom of the $118-120 resistance range. Stochastic overbought at 89. Will add more close to $120.

RIMM (long)--breaking ot of triangle after remounting 50 day moving average.

Gold (short via inverse ETF DZZ, using GLD chart to show from long perspective)--extended. much more so than previous runnups.

AAPL (short)-- extended. overbought stochastic at +90 reading. RSI divergence.

Wednesday, September 29, 2010
AAPL short
I went short AAPL prior to the trendline break at $292 (see Trade Report). Looking to take profits in the $180-185 range:


Tuesday, July 27, 2010
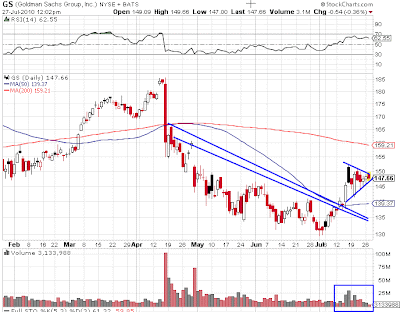
Today's Entry: GS
I entered GS today. Nice triangle pattern formed post trend breakout. Nice volume within triangle as well.

Thursday, June 24, 2010
Today's Entries: NFLX and ADM
I entered NFLX and ADM today.
NFLX has pulled back to the 20 day ma, oversold, and is trending nicely. Could be a pivot level, though the risk is pullback continues to the 50 day ma.

NFLX has pulled back to the 20 day ma, oversold, and is trending nicely. Could be a pivot level, though the risk is pullback continues to the 50 day ma.

Thursday, June 10, 2010
Breakout-Pullback: VMW
I entered VMW yesterday on a breakout-pullback setup. Note that stochastics are now oversold and price has moved back to the bottom of the breakout bar on declining volume.


Wednesday, February 24, 2010
Trade: BA
I entered BA today post breakout from a triangle pattern. The stock seems to be forming a Tight Flag post breakout.
I am also short IOC, SPY and RL

I am also short IOC, SPY and RL

Friday, November 20, 2009
Today's Entry: STP
I entered STP today on weakness. The stock has shown strong strength in relation to the market, and shows a strong volulme pattern on the recent move up. My target is the September high.


Saturday, November 07, 2009
Breakout-Pullback: MSTR
MSTR has formed a classic breakout-pullback setup. The stock recently broke out on huge volume, and since has consolidated in an orderly fashion.
I entered this trade around $84, which I posted in the Trade Report last week. My intitial target is $90, where I would take a partial profit. At that point I would move my stop up to entry.

I entered this trade around $84, which I posted in the Trade Report last week. My intitial target is $90, where I would take a partial profit. At that point I would move my stop up to entry.

Tuesday, October 06, 2009
Anatomy of a Successful SPY Trade - Moving Average Oversold Bounce Setup
This setup was given to Trade Report subscribers. SPY was marked as a "bounce trade" setup on Friday as it neared the 50 day moving average and became short term oversold using stochastics as the oversold indicator. I entered Monday morning on confirmation.
The stop was set under the 50 day moving average, with an initial target of $106--giving 3:1 reward to ratio.
The stock is now near resistance. Notice the distributive volume pattern. This suggests failure at resistance. Entry in the $106-108 range offers a decent short setup.

Note: I used SSO (leveraged SPY ETF) as my trading vehicle, but am using SPY as the example since more people trade with SPY.
The stop was set under the 50 day moving average, with an initial target of $106--giving 3:1 reward to ratio.
The stock is now near resistance. Notice the distributive volume pattern. This suggests failure at resistance. Entry in the $106-108 range offers a decent short setup.

Note: I used SSO (leveraged SPY ETF) as my trading vehicle, but am using SPY as the example since more people trade with SPY.
Thursday, September 24, 2009
Trade Update
Trade Update that I sent subscribers:
I took profits and exited half my BIDU short at $380 (average entry $402.44).
I was stopped out of ENER long position at $12.40 for a small loss.
I took profits on the remaining shares of AIG long position at $46. One of my best trades in quite some time.
I am still holding JAZZ long. AMZN and BIDU partial position short. Both charts are doing well, while JAZZ is still holding support.
Near the open I entered two inverse ETFs I mentioned last night in "shorts near entry"- SKF ($24.80) and SRS (9.55). I also entered STEC at I am kicking myself for not also adding DTO and short setup STEC--the stock I charted last night. I may add on a pullback.
Paul
www.themarketspeculator.blogspot.com
I took profits and exited half my BIDU short at $380 (average entry $402.44).
I was stopped out of ENER long position at $12.40 for a small loss.
I took profits on the remaining shares of AIG long position at $46. One of my best trades in quite some time.
I am still holding JAZZ long. AMZN and BIDU partial position short. Both charts are doing well, while JAZZ is still holding support.
Near the open I entered two inverse ETFs I mentioned last night in "shorts near entry"- SKF ($24.80) and SRS (9.55). I also entered STEC at I am kicking myself for not also adding DTO and short setup STEC--the stock I charted last night. I may add on a pullback.
Paul
www.themarketspeculator.blogspot.com
Tuesday, September 22, 2009
AIG and the Breakout-Pullback Setup
Back on September 9th, when I posted about entering AIG, it has pulled back post breakout and showed a great accumulation pattern.
Since then the stock has catapulted back up towards the recent highs. I entered at $37, took a partial exit and am still holding a positon near $52.
The key features of the breakout pullback setup include:
1. Price breakout over resistance
2. Breakout on strong volume
3. An orderly pullback, with small price bars and decreasing volume
4. Volume pattern should show accumulation

Since then the stock has catapulted back up towards the recent highs. I entered at $37, took a partial exit and am still holding a positon near $52.
The key features of the breakout pullback setup include:
1. Price breakout over resistance
2. Breakout on strong volume
3. An orderly pullback, with small price bars and decreasing volume
4. Volume pattern should show accumulation

Wednesday, September 09, 2009
Recent Trades: FUQI, DZZ, SPY, AMZN
I made the following trades today, which were sent to subscribers intra-day:
Shorts: FUQI, SPY, long DZZ (GLD short)
Long Exit: AMZN (entry at $78, exit at $81.10)
I'll detail the setups tonight or tomorrow.
Shorts: FUQI, SPY, long DZZ (GLD short)
Long Exit: AMZN (entry at $78, exit at $81.10)
I'll detail the setups tonight or tomorrow.
Monday, July 13, 2009
Charts: BRE and PALM
I entered two trades today. PALM is a trend pullback setup and BRE is oversold bounce.


Thursday, June 18, 2009
Trade Update: SPY and DIG
As noted to trade report members yesterday I entered SPY at $91.61 and DIG at $28.33.
The SPY trade is based on anticipation of a morning star candle formation completing. Small loss if stopped out. Potential for big gain.
DIG anticipates oversold bounce on test of moving average.

The SPY trade is based on anticipation of a morning star candle formation completing. Small loss if stopped out. Potential for big gain.
DIG anticipates oversold bounce on test of moving average.

Monday, June 08, 2009
Trade Update: AAPL
I took partial profits in my AAPL trade today. I have moved my stop up to entry and am letting the rest "ride".
Thursday, May 28, 2009
Today's Trade: PCX
I entered 400 shares of PCX at an average price of $8.66. My stop is around $7.40 and my initial target is $10.50. This gives me a 2:1 reward to risk ratio.
As noted in the blog and report last night, the coal sector looks great and PCX shows strong accumulation and a bull flag setup.
Those looking to enter can do so at this level or better yet, on a slight dip.

Tuesday, May 26, 2009
Today's Trades: SKF and SRS
I used today's strength to enter two bearish focus list stocks today, SKF (financials) and SRS (real estate). Both are inverse shorts. Note that strong volume pattern during the price consolidation range.
There is still room to pullback, so I used small position size.
300 shares SKF at $44.11
400 shares SRS at average price of $20.91.
Stops are place below recent lows.

There is still room to pullback, so I used small position size.
300 shares SKF at $44.11
400 shares SRS at average price of $20.91.
Stops are place below recent lows.

Monday, May 18, 2009
Trades: BKE and RL
I used morning strength to short two stocks from last night's focus list: BKE and RL. See charts from the last post to see setup.
Subscribe to:
Posts (Atom)