
Showing posts with label accumulation. Show all posts
Showing posts with label accumulation. Show all posts
Tuesday, July 27, 2010
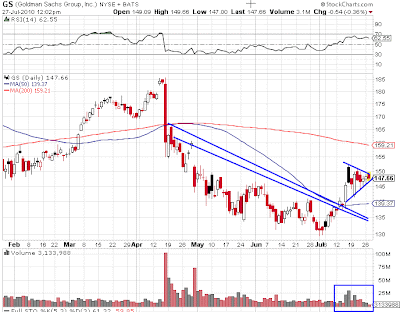
Today's Entry: GS
I entered GS today. Nice triangle pattern formed post trend breakout. Nice volume within triangle as well.


Friday, November 20, 2009
Today's Entry: STP
I entered STP today on weakness. The stock has shown strong strength in relation to the market, and shows a strong volulme pattern on the recent move up. My target is the September high.


Wednesday, September 09, 2009
AIG is a Great Low Risk Setup
AIG's volume pattern shows that it is under accumulation. This pullback offers a low risk setup. If entered around $37, with a stop under the 20 day moving average at $34.50 and target near the recent high at $50, we are looking at a 6:1 reward ratio.
If you find enough trades like this, you only need to be correct 1 out of every 5 trades to make decent profits!

If you find enough trades like this, you only need to be correct 1 out of every 5 trades to make decent profits!

Thursday, August 20, 2009
CX Chart
CX has a great looking chart that shows strong accumulation (volume pattern) and is breaking out to highs. The stock is extended, so I will wait for a pullback for entry.


Tuesday, May 26, 2009
Today's Trades: SKF and SRS
I used today's strength to enter two bearish focus list stocks today, SKF (financials) and SRS (real estate). Both are inverse shorts. Note that strong volume pattern during the price consolidation range.
There is still room to pullback, so I used small position size.
300 shares SKF at $44.11
400 shares SRS at average price of $20.91.
Stops are place below recent lows.

There is still room to pullback, so I used small position size.
300 shares SKF at $44.11
400 shares SRS at average price of $20.91.
Stops are place below recent lows.

Wednesday, May 20, 2009
Strategy Session: Using Distribution Patterns to Predict Trends and Trend Failure
The second most important aspect of my trading strategy (behind support and resistance) is using volume to classify stocks that are under accumulation and distribution.
Distribution is under way when, over a period of time, stocks show higher volume on down days and lower volume on up days. In a bullish trend, this predicts the trend will pullback or fail. In a bearish trend, expect the trend to continue until the distribution pattern is reversed.
Take a look at GME. This stock shows classic distribution. During the recent uptrend, positive volume was putrid. Trend failure was easily predicted. Currently, the distribution pattern is continuing. This suggests a retest of recent lows.
I will likely short this stock soon.

Distribution is under way when, over a period of time, stocks show higher volume on down days and lower volume on up days. In a bullish trend, this predicts the trend will pullback or fail. In a bearish trend, expect the trend to continue until the distribution pattern is reversed.
Take a look at GME. This stock shows classic distribution. During the recent uptrend, positive volume was putrid. Trend failure was easily predicted. Currently, the distribution pattern is continuing. This suggests a retest of recent lows.
I will likely short this stock soon.

Wednesday, April 15, 2009
On the Radar: Residentials
Residential Real Estate and homebuilders is one of the hottest sectors right now, showing strong accumulation, price patterns and relative strength. One of my favorites is DHI. The chart speaks for itself . . .


Sunday, March 01, 2009
A Crappy Picture That Clarifies the Ideal Volume Pattern
This picture I created ain't pretty, but it does a good job of showing the type of volume pattern I look for during bottom formations:


Monday, December 08, 2008
Chart: DIG
There's a lot to like about the DIG chart:
1. Postive RSI divergence
1. Postive RSI divergence
2. Successful test of bottom support
3. Long tail price bar at support
4. Oversold stochastic turning up
5. Strong obv and volume action


Tuesday, November 11, 2008
The FXI Answer
I left my analysis of FXI open ended in the last post and a few of you seem to think I was bearish!
The pattern is in fact quite bullish, and points to a bottom formation. Compare the current volume pattern to that during the top and bear run. For the first time, positive volume exceeds negative volume, while price forms a volatile trading range at the lows. This is a bullish pattern!
However, lows can still be tested, so I will only enter on weakness.
The pattern is in fact quite bullish, and points to a bottom formation. Compare the current volume pattern to that during the top and bear run. For the first time, positive volume exceeds negative volume, while price forms a volatile trading range at the lows. This is a bullish pattern!
However, lows can still be tested, so I will only enter on weakness.
China's Chart Give's a Clear Answer
The FXI weekly chart is quite illuminating and a good example of the importance of volume. What does the current volume pattern tell us? Compare to the previous volume patterns during the top and bear run, and the answer is clear . . .


Monday, November 03, 2008
Education Stocks Showing Accumulation and Relative Strength
A few sectors asserted themselves during last week's market up move. Education stocks are on fire and showing buying interest from the big boys. While most stocks are coming off bottoms and nearing resistance levels, education stocks are near recent highs.
Focus list stocks include EDU, DV, CPLA and APOL.

Focus list stocks include EDU, DV, CPLA and APOL.

Wednesday, July 16, 2008
The Line
I could not have imagined the QLD trade working better than it has. I took partial profits at $72.88 today (entered at $67.88, as noted in the free trial of the Trade Report) for a $1250 gain (+7.3%). I've moved my stop on the remaining position up to my entry point, and have had thoughts about moving it up to $70.
The key level is the $78-79 range. That is the first major area of resistance for this bounce to bump up against. This level has been important over the past year. Notice on the chart below how price moves along this line. The April breakout did not mount this level until it pulled back first.
The "line" is where I will likely reverse from long to short. It's a great short entry, where a logical stop could be placed either just above the "line" or above the 50 day MA. This assumes volume patterns play out. If I see true accumulation, I doubt I'll short.

The key level is the $78-79 range. That is the first major area of resistance for this bounce to bump up against. This level has been important over the past year. Notice on the chart below how price moves along this line. The April breakout did not mount this level until it pulled back first.
The "line" is where I will likely reverse from long to short. It's a great short entry, where a logical stop could be placed either just above the "line" or above the 50 day MA. This assumes volume patterns play out. If I see true accumulation, I doubt I'll short.

Monday, June 23, 2008
Trade Entry: TRA
I bought 500 shares of TRA at $53.12.
Setup: A combo platter of a breakout and trend-pullback and entering within a forming high and tight flag. I expect a continuation of the trend. Great volume pattern and RSI and stochastics confirm price highs. The stock is under accumulated here.
Risk: My intial target is the recent high at $60. My stop is just under the forming consolidation area.
Concerns: No doubt, the stock (and sector) is overbought. However, momentum and volume are so strong that I'm betting the trend will continue.

Setup: A combo platter of a breakout and trend-pullback and entering within a forming high and tight flag. I expect a continuation of the trend. Great volume pattern and RSI and stochastics confirm price highs. The stock is under accumulated here.
Risk: My intial target is the recent high at $60. My stop is just under the forming consolidation area.
Concerns: No doubt, the stock (and sector) is overbought. However, momentum and volume are so strong that I'm betting the trend will continue.

Monday, March 31, 2008
Trade Portfolio Charts: GTLS and DZZ
GTLS is an earnings breakout play that has shown accumultion as it consolidates the breakout move. A key day was early last weak when it confirmed the hammer the stock printed at the breakout point. The RSI and OBV trends are positive and the volume pattern has favored up days.
My target is the recent high of $38, while my stop is just under the breakout point, around $31. This gives me a nice 2.5:1 reward to risk ratio.

I am using the well known gold ETF GLD to detail why I entered DZZ, which is a leveraged inverse short ETF. I am using this chart because it gives a good example of how I like to play "fallen momo stocks". Note that Gold is showing many of the elements that DBA and other ag stocks showed as they broke down.
Why use an inverse ETF rather than short GLD or other gold stocks? The short ansser is I don't have to borrow shares, thus I don't incur any interest charges.

Updated Trading Results:

My target is the recent high of $38, while my stop is just under the breakout point, around $31. This gives me a nice 2.5:1 reward to risk ratio.

I am using the well known gold ETF GLD to detail why I entered DZZ, which is a leveraged inverse short ETF. I am using this chart because it gives a good example of how I like to play "fallen momo stocks". Note that Gold is showing many of the elements that DBA and other ag stocks showed as they broke down.
Why use an inverse ETF rather than short GLD or other gold stocks? The short ansser is I don't have to borrow shares, thus I don't incur any interest charges.

Updated Trading Results:

Monday, March 24, 2008
Homebuilders are Hard to Ignore
It's tough to ignore the strong move in residential construction, aka, homebuilders. While my head tells me to stay away, the charts tell me otherwise. For months I have been using bounces in the sector to reload shorts, but not this time. There is something different about this bounce.
Take a look at the chart of Toll Brothers. A few things jump out at me:
1. The stock is no longer trending down. Rather, we see a range bound price movements with resistance around 24.
2. RSI is improved. The mid level is acting as support, which is what happens in strong stocks.
3. OBV is improving. Volume patterns seem to be shifting from sell to buy.

I would not buy here. In a range bound market, I like to make buys at the bottom of the range or on breakout. A patient well timed entry could lead to nice profits in TOL.
Take a look at the chart of Toll Brothers. A few things jump out at me:
1. The stock is no longer trending down. Rather, we see a range bound price movements with resistance around 24.
2. RSI is improved. The mid level is acting as support, which is what happens in strong stocks.
3. OBV is improving. Volume patterns seem to be shifting from sell to buy.

I would not buy here. In a range bound market, I like to make buys at the bottom of the range or on breakout. A patient well timed entry could lead to nice profits in TOL.
Friday, February 22, 2008
Analyzing Today's Trade: WMS
I bought 400 shares of WMS at $39.05, based on my breakout-pullback trading setup. The stock broke on strong volume earlier this month, while pulling back on diminishing volume. Today's confirmation candle at two tiered support (20 day moving average and price) provide the entry signal. Also note that OBV is in a strong uptrend and stochastics are oversold and turning up.

Take a look at the chart and note the difference between the current breakout (green arrow) and the December failed breakout (blue arrow). What is the key difference between the two breakouts?
Accumulation. You here me talk about it all the time, and this chart provides a great example of how important it is to monitor accumulation patterns. The December breakout was destined to fail, as up volume barely moved as price climbed. OBV during this period stayed within a mediocre range, further questioning the breakout.
Now look at the current breakout. Not only is price breaking out, but OBV is as well. Volume is motoring higher, and today's confirmation move was on above average volume as well. This leads me to believe we will at least retest the recent high.

Take a look at the chart and note the difference between the current breakout (green arrow) and the December failed breakout (blue arrow). What is the key difference between the two breakouts?
Accumulation. You here me talk about it all the time, and this chart provides a great example of how important it is to monitor accumulation patterns. The December breakout was destined to fail, as up volume barely moved as price climbed. OBV during this period stayed within a mediocre range, further questioning the breakout.
Now look at the current breakout. Not only is price breaking out, but OBV is as well. Volume is motoring higher, and today's confirmation move was on above average volume as well. This leads me to believe we will at least retest the recent high.
Thursday, February 07, 2008
Is the Market Speculator Really Long a Homebuilder?
I've been very busy, so I haven't had a chance to update my trades. As stated in the comments section this morning, I unloaded a bunch of shorts and entered a few longs. I would like to add some more shorts on bounce.
My bias is still to the down side, but I don't want to give up the big gains I've already made. I am keeping a few shorts in case we go down more before we bounce.
A lot of you have e-mailed in shock over my long position in HOV (posted entry in comments section), a homebuilder. Todd S. asked a question is representative of most of the emails I received: WTF are you short a homie when you have been shorting the shit out of the sector over the past year?
Good question Todd. Fundamentally, and longer term, I still don't like the sector. I agree with most that credit and housing problems aren't going away any time soon. However, as a technician who lives and dies by trading accumulation and distribution patterns, I cannot ignore what is going on in the sector. Take a look at the HOV chart:

Key points:
1. Strong breakout over downtrend line and 50 day moving average.
2. Distribution pattern shows accumulation during run up, with strong volume on up days and low volume on pullback.
3. RSI divergence (see orange dotted line on price and RSI) shows strong relative momentum.
These three factors lead me to believe we have a short term reversal in play. I expect to see a retest of the recent high. Not sure if we'll get a breakout at the high, but retesting the high alone would give us a 30 percent gain.
Some have pointed out that I may have entered early. The 50 day moving average is at 7.63, so I do understand the criticism. Maybe I could have waited for more of a pullback. Normally I would. The reason I did not is that I am expecting a bit of a market bounce in the coming days. Lately homies have been leading the market bounces, so it makes sense to enter now. I have a decent risk to reward at 2:1.
My bias is still to the down side, but I don't want to give up the big gains I've already made. I am keeping a few shorts in case we go down more before we bounce.
A lot of you have e-mailed in shock over my long position in HOV (posted entry in comments section), a homebuilder. Todd S. asked a question is representative of most of the emails I received: WTF are you short a homie when you have been shorting the shit out of the sector over the past year?
Good question Todd. Fundamentally, and longer term, I still don't like the sector. I agree with most that credit and housing problems aren't going away any time soon. However, as a technician who lives and dies by trading accumulation and distribution patterns, I cannot ignore what is going on in the sector. Take a look at the HOV chart:

Key points:
1. Strong breakout over downtrend line and 50 day moving average.
2. Distribution pattern shows accumulation during run up, with strong volume on up days and low volume on pullback.
3. RSI divergence (see orange dotted line on price and RSI) shows strong relative momentum.
These three factors lead me to believe we have a short term reversal in play. I expect to see a retest of the recent high. Not sure if we'll get a breakout at the high, but retesting the high alone would give us a 30 percent gain.
Some have pointed out that I may have entered early. The 50 day moving average is at 7.63, so I do understand the criticism. Maybe I could have waited for more of a pullback. Normally I would. The reason I did not is that I am expecting a bit of a market bounce in the coming days. Lately homies have been leading the market bounces, so it makes sense to enter now. I have a decent risk to reward at 2:1.
Sunday, January 06, 2008
Anatomy of a Broken Momentum Stock - Bad Signs For Market
I am seeing a lot of momentum stocks which have broke down below their trend lines. CPLA is a good example. During the trend, the stock has continually bounced off either the 20 day or 50 day moving average. Just as important, down moves have not shown much distribution.
That's not the case right now. We've seen a high volume move below the 50 day moving average, and volume continues to show a negative pattern.
The fact that there are so many momo stocks that look like CPLA means one of three things:
1- new momo leadership is emerging.
2- the market is going to tank
3- correction that will resume.
The most likely possibility is 1 or 2. I have a feeling it might be 2, because the negativity cuts across so many momentum plays and sectors.

That's not the case right now. We've seen a high volume move below the 50 day moving average, and volume continues to show a negative pattern.
The fact that there are so many momo stocks that look like CPLA means one of three things:
1- new momo leadership is emerging.
2- the market is going to tank
3- correction that will resume.
The most likely possibility is 1 or 2. I have a feeling it might be 2, because the negativity cuts across so many momentum plays and sectors.

Wednesday, October 24, 2007
Earnings Breakout Chart: EDU
EDU broke out from a cup and handle formation and is currently digesting gains. Notice the positive volume trend, which signals that big players are accumulating the stock. I am looking for a breakout-pullback play, and will look to enter on a pullback to the $70-72 range.


Subscribe to:
Posts (Atom)