
Showing posts with label analyze this trade. Show all posts
Showing posts with label analyze this trade. Show all posts
Thursday, April 30, 2009
Short Setup: NTRS
I went short NTRS this morning. The stock has broke down below support, pulled back and shows a negative volume pattern.


Wednesday, October 01, 2008
Trade Entry: POT
I entered POT today as a bounce play at $125.10. As I have been preaching, postion size is small.
Reasons for entry:
1. Stochastics oversold
2. Extreme weakness today
3. Positive divergences in RSI and OBV (indicators are making higher lows while price is a lower low).
Risks:
1. Continuation of downtrend
2. Negative market reaction to tonights bailout plan.

Reasons for entry:
1. Stochastics oversold
2. Extreme weakness today
3. Positive divergences in RSI and OBV (indicators are making higher lows while price is a lower low).
Risks:
1. Continuation of downtrend
2. Negative market reaction to tonights bailout plan.

Monday, September 29, 2008
Trade Update
I took partial profits in DUG today for a big gain at two points, $40 and $42. I am still holding a position.
I exited AAPL for a big loss.
I was stopped out of USD for a very small loss.
I was stopped out of X for a small loss.
I bought SSO at an average price of $46.11 during panic selling.
I bought POT at an average price of $128.37 during panic selling.
Note that all position sizes are small. For example, with the SSO trade, I am not even risking .2 percent of my portfolio. I can take a number of lossed before even making a dent. My thought process right now is to be willing to take some small losses with the possibility of a big gain.
I exited AAPL for a big loss.
I was stopped out of USD for a very small loss.
I was stopped out of X for a small loss.
I bought SSO at an average price of $46.11 during panic selling.
I bought POT at an average price of $128.37 during panic selling.
Note that all position sizes are small. For example, with the SSO trade, I am not even risking .2 percent of my portfolio. I can take a number of lossed before even making a dent. My thought process right now is to be willing to take some small losses with the possibility of a big gain.
Friday, September 12, 2008
Trade Entries: KSS, ARO and LOW
Retail stocks are nearing my entry levels. However, the negative retail report could pull them down further. For this reason, I am taking small position sizes in my retail trades and using tight stops--KSS, ARO and LOW.
I bought 150 shares of KSS at $50.44
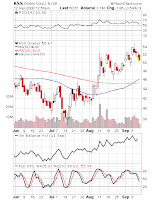
I bought 150 shares of ARO at $34.02

I bought 200 shares of LOW at $25.30

I bought 150 shares of KSS at $50.44

I bought 150 shares of ARO at $34.02

I bought 200 shares of LOW at $25.30

Monday, April 21, 2008
Trades: POT and CAT
I am short 100 shares of POT at $208.77. This trade is similar to the failed trade I made in HAL. Basically, I set a short-limit order to go short at $208 this morning. The idea is the stock is so extended that a strong open would likely pull back. Considering the market is also overbought, I will likely keep this trade open for a few days. With these types of speculative trades that go against the trend, I use a tight stop and small position size.

I am long 300 shares of CAT at $83.07. This is a classic breakout-pullback play. The stock could still pullback a little more, which is why I went with only 300 shares. I will likely buy 200 more if it pulls back to $81-82.


I am long 300 shares of CAT at $83.07. This is a classic breakout-pullback play. The stock could still pullback a little more, which is why I went with only 300 shares. I will likely buy 200 more if it pulls back to $81-82.

Tuesday, April 15, 2008
Pioneer Trade: HAL
I usually do not short extended stocks unless I see a major divergence signal or at least one distrubution day. However, I decided to take a small short position in HAL today.
Technically, the stock still looks great and there are no major divergences. The 52 week high in price is confirmed by RSI, OBV and stochastics. So why am I making an exception to my "don't short strong momo stocks" rule?
The answer is the stock has gone too far without a pullback, is now extremely oversold, and significantly above the 50 day moving average. I recently researched momo stocks going back six years and found this is a good, quick short opportunity.
Looking at this stock over the past year, when it does make a run it lasts 8-10 points (see May, August and February). The stock has currently run up about 10 points. I see a pullback in its future.
Note that I don't go "all-in" with this setup. I use a small position size with tight risk management. For this trade, I went short 200 shares at $44.83. My stop is in the $46-47 range with a target of $40. This gives me a reward to risk ratio of 2:1.

Technically, the stock still looks great and there are no major divergences. The 52 week high in price is confirmed by RSI, OBV and stochastics. So why am I making an exception to my "don't short strong momo stocks" rule?
The answer is the stock has gone too far without a pullback, is now extremely oversold, and significantly above the 50 day moving average. I recently researched momo stocks going back six years and found this is a good, quick short opportunity.
Looking at this stock over the past year, when it does make a run it lasts 8-10 points (see May, August and February). The stock has currently run up about 10 points. I see a pullback in its future.
Note that I don't go "all-in" with this setup. I use a small position size with tight risk management. For this trade, I went short 200 shares at $44.83. My stop is in the $46-47 range with a target of $40. This gives me a reward to risk ratio of 2:1.

Friday, April 11, 2008
Today's Entry: CSX, DZZ and MTL
I bought 100 shares of MTL at $143.46. The strong broke out over $140 yesterday on strong volume. It's one of the strongest stocks in a strong sector showing loads of accumulation. I may be a bit early on entry (I usually don't enter at overbought stochastic levels), as the stock could pullback to $140. That's why I went with a small position size and may buy more at $140.

I bought 300 shares of CSX at $56.10. Another strong stock from a strong sector at the bottom of a high tight flag pattern.

I bought 500 shares of DZZ at $26.55. This ETF is 2X short gold. Gold has setup nicely as a broken momo that is retracing weekly to resistance levels.


I bought 300 shares of CSX at $56.10. Another strong stock from a strong sector at the bottom of a high tight flag pattern.

I bought 500 shares of DZZ at $26.55. This ETF is 2X short gold. Gold has setup nicely as a broken momo that is retracing weekly to resistance levels.

Saturday, March 15, 2008
Saturday Review: Shorting Momentum Stocks
This post from August 2007 offers some timely advice on shorting momentum stocks:

Those of you familiar with my trading style know I rarely short high flying stocks. While it seems logical to go against a stock that is overextended, this type of trade generally takes on too much risk. Stocks tend to trend longer than they "should" due to market psychology and short squeezes.
However, there is one contrarian setup that I do use on momentum stocks. A stock that reaches it's high, without RSI and OBV confirming the move, gets my attention as a short play.
Take a look at the GRMN chart. During the last high, OBV and RSI levels were higher than they are now. This "negative divergence" is a sign that the stock is not ready to rocket to new highs.
A negative divergence is not enough to jump in. We also need to see a failure at the old high level. We've got that here with GRMN. The stock stopped right at $105 and has pulled back.
The last piece of the puzzle is volume. Volume patterns in this stock are not bullish. We've seen more volume on the downside than upside. This was enough to get me in as a short today.

Those of you familiar with my trading style know I rarely short high flying stocks. While it seems logical to go against a stock that is overextended, this type of trade generally takes on too much risk. Stocks tend to trend longer than they "should" due to market psychology and short squeezes.
However, there is one contrarian setup that I do use on momentum stocks. A stock that reaches it's high, without RSI and OBV confirming the move, gets my attention as a short play.
Take a look at the GRMN chart. During the last high, OBV and RSI levels were higher than they are now. This "negative divergence" is a sign that the stock is not ready to rocket to new highs.
A negative divergence is not enough to jump in. We also need to see a failure at the old high level. We've got that here with GRMN. The stock stopped right at $105 and has pulled back.
The last piece of the puzzle is volume. Volume patterns in this stock are not bullish. We've seen more volume on the downside than upside. This was enough to get me in as a short today.
I went short 100 shares of GRMN at $102.65.
Note that I am not making a big bet here. I took a small position and my stop is above the old high at $105.50. I am risking less than $300. It's never a good idea to make big bets against the trend.
Wednesday, March 05, 2008
Market Notes and a Trade
There has been some confusion that I would like to clear up. Some of you think that I am bullish on the market because I am making long play on the S&P 500. Nothing could be further from the truth. This is a short term bounce play within a downtrending market. Until the indexes can break resistance, I am a bear who is willing to play situational longs.
This is the time to play a few bounces and get ready to reload shorts. For short plays, I am looking for broken stocks on my short list (stocks that have topped and now downtrending) that are making feeble bounce attempts.
This morning I added some to my DECK short, 50 shares at $107.35. If we continue to bounce on low volume tomorrow, you can bet I will add some more shorts.
This is the time to play a few bounces and get ready to reload shorts. For short plays, I am looking for broken stocks on my short list (stocks that have topped and now downtrending) that are making feeble bounce attempts.
This morning I added some to my DECK short, 50 shares at $107.35. If we continue to bounce on low volume tomorrow, you can bet I will add some more shorts.
Friday, February 08, 2008
How I Made 5 Grand in One Week
As mentioned in the comments section yesterday, I unloaded a number of shorts and entered a few longs:
I covered 100 shares of FSLR (short at $187.33) at $164.67 for a $2266 (+12.1%).
I covered 200 shares of MON at $102.43 (short at $114.27) for a $2454 (+10.7%).
I covered 75 shares of GS at 188.06 (short at $202.55) for a $1086 gain (+7.7%).
I covered 400 shares of DNR at $27.01 (short at $26.01) for a $404 loss (-3.8%).
I exited 300 shares of PAAS at $34.62 (entry at $35.86) for a $372 loss (-3.6%).
I bought 300 shares of ANR at $34.05 (currently at $35.44).
I bought 400 shares of HOV at $9.32 (currently at 8.73).
I am still holding DUG (ETF short oil and gas), ANR (long), PRXL (long) and AGU (short).
February performance on completed trades:
3 wins
2 losses
win rate: 60%
average gain: $1935
average loss: $388
total gains: $5806
total losses: $-776
Total Profit: $5030.
Not a bad haul for 7 days of work. Now lets hope I don't lose it all in the coming week.
While I am not happy about the win rate, at least maximizing gains and minimizing losses. Over the weekend, I plan to analyze a few of the trades I made. This type of trade review will become a regular feature of the site. First up will be FSLR. Take a look at the chart and see if you can get behind my strategy

BTW, for those new to the site, all entries can be viewed by going to the trade label or just scrolling down and viewing my Febuary posts.
I covered 100 shares of FSLR (short at $187.33) at $164.67 for a $2266 (+12.1%).
I covered 200 shares of MON at $102.43 (short at $114.27) for a $2454 (+10.7%).
I covered 75 shares of GS at 188.06 (short at $202.55) for a $1086 gain (+7.7%).
I covered 400 shares of DNR at $27.01 (short at $26.01) for a $404 loss (-3.8%).
I exited 300 shares of PAAS at $34.62 (entry at $35.86) for a $372 loss (-3.6%).
I bought 300 shares of ANR at $34.05 (currently at $35.44).
I bought 400 shares of HOV at $9.32 (currently at 8.73).
I am still holding DUG (ETF short oil and gas), ANR (long), PRXL (long) and AGU (short).
February performance on completed trades:
3 wins
2 losses
win rate: 60%
average gain: $1935
average loss: $388
total gains: $5806
total losses: $-776
Total Profit: $5030.
Not a bad haul for 7 days of work. Now lets hope I don't lose it all in the coming week.
While I am not happy about the win rate, at least maximizing gains and minimizing losses. Over the weekend, I plan to analyze a few of the trades I made. This type of trade review will become a regular feature of the site. First up will be FSLR. Take a look at the chart and see if you can get behind my strategy

BTW, for those new to the site, all entries can be viewed by going to the trade label or just scrolling down and viewing my Febuary posts.
Friday, December 14, 2007
Trade Update, Watchlist, Sport and Politics
I added two shorts yesterday, AKAM and FCX. I also went long PBR, JASO and AAPL.
Here are the stocks I've been keying on from my focus list:
Long: PBR, USO, FLSR, CPLA, AAPL, HDB, MBT, RIG, ATK, MA, MON, MOS, AGU, JASO, AAPL, MTL, RSX, VIP, STP, POT
Short: DRYS, TBSI, DSX, PHM, HOV, FXI, PCU, FCX, AKAM, NCTY, LFC, MER, FRE, TGT, LOW, NILE, GG, RIO
Off-Topic:
Is anybody surprised that a mean, angry old pitcher who posted a 2.30 era at the age of 44 took steroids? I hope the sporting public is as incensed about Clemens as it has been towards Bonds. That might help restore my teetering faith that we live in a color blind society.
Why does nobody care when a football player tests positive for performance enhancing drugs (like defensive star Shawn Merriman), but in baseball it's a national crisis with Congress threatening to step in?
How does a guy like Bobby Petrino get away with his actions? If I were a parent of a kid considering attending Arkansas, there is no way in hell I would let that man coach my son.
I hope the Patriots beat the Jets 100-0. That probably won't be the score, but revenge will definately be sweet.
I can't stand Oprah, but I do hope her followers get out and vote for Obama.
Note to Oprah fans: she hasn't given away shit. When Oprah "gives" cars to her audience, it's Pontiac, not Oprah, you should be thanking.
A tale of two idiots: Huckabee and Romney. I wonder if the combined IQs of those two, plus junior Bush and Giuliani, are equal to that of one Bill Clinton.
Here are the stocks I've been keying on from my focus list:
Long: PBR, USO, FLSR, CPLA, AAPL, HDB, MBT, RIG, ATK, MA, MON, MOS, AGU, JASO, AAPL, MTL, RSX, VIP, STP, POT
Short: DRYS, TBSI, DSX, PHM, HOV, FXI, PCU, FCX, AKAM, NCTY, LFC, MER, FRE, TGT, LOW, NILE, GG, RIO
Off-Topic:
Is anybody surprised that a mean, angry old pitcher who posted a 2.30 era at the age of 44 took steroids? I hope the sporting public is as incensed about Clemens as it has been towards Bonds. That might help restore my teetering faith that we live in a color blind society.
Why does nobody care when a football player tests positive for performance enhancing drugs (like defensive star Shawn Merriman), but in baseball it's a national crisis with Congress threatening to step in?
How does a guy like Bobby Petrino get away with his actions? If I were a parent of a kid considering attending Arkansas, there is no way in hell I would let that man coach my son.
I hope the Patriots beat the Jets 100-0. That probably won't be the score, but revenge will definately be sweet.
I can't stand Oprah, but I do hope her followers get out and vote for Obama.
Note to Oprah fans: she hasn't given away shit. When Oprah "gives" cars to her audience, it's Pontiac, not Oprah, you should be thanking.
A tale of two idiots: Huckabee and Romney. I wonder if the combined IQs of those two, plus junior Bush and Giuliani, are equal to that of one Bill Clinton.
Tuesday, November 27, 2007
Trade Analysis via Video Webcast
Last night I created a video highlighting a few of my trades (MA, AAPL, GOOG, NOV). I had problems uploading, so the post is a little late. I have already taken profits in the NOV short.
Yesterday's trades:
As noted in yesterday's video, I went into the week with my bear hat on. I don't trust this market. Price action has been horrid of late. It's not just the distribution days, but the nature of the subsequent consolidation. Every attempt at a bounce has been met by quick profit taking.
That's why today's opening strength was so appealing to me, both for profit taking and to initiate shorts. There was no underlying strength by way of volume and breadth, which lead me to believe their would be no upward momentum.
I sold my remaining 300 shares of MA at $187.55 (entry at $181.04) for a $1953 gain (+3.6%).
I exited my TOL short late in the day. On the 14th I went short 200 shares at $22.44 and 300 at $21.46 on the 13th. I covered today at $18.22 for a $1812 gain (+18.1%).
A bounce in the housing sector would likely to again short TOL or other builders. MA is setting up again for a bounce, as it closed around $181.
I bought 600 shares of QID at $40.26. In the video analysis, I stated I would enter in the $38-40 range, but today's open was too good to pass up.
I went short 500 shares of NOV at $69.44. This is a classic reaction back up the breakout bar. The stock closed at $66.91 and my target is in the $63-64 range.
I went short 300 shares of AAPL at $176.08 later in the day. The stock had climbed above $176 early in the day, pulled back and mounted this level in the afternoon. I went short when the bulls failed to hold the high, on the break of the morning high. The small position size reflects the fact that this stock will likely enjoy a big bounce if the market stabilizes.

Yesterday's trades:
As noted in yesterday's video, I went into the week with my bear hat on. I don't trust this market. Price action has been horrid of late. It's not just the distribution days, but the nature of the subsequent consolidation. Every attempt at a bounce has been met by quick profit taking.
That's why today's opening strength was so appealing to me, both for profit taking and to initiate shorts. There was no underlying strength by way of volume and breadth, which lead me to believe their would be no upward momentum.
I sold my remaining 300 shares of MA at $187.55 (entry at $181.04) for a $1953 gain (+3.6%).
I exited my TOL short late in the day. On the 14th I went short 200 shares at $22.44 and 300 at $21.46 on the 13th. I covered today at $18.22 for a $1812 gain (+18.1%).
A bounce in the housing sector would likely to again short TOL or other builders. MA is setting up again for a bounce, as it closed around $181.
I bought 600 shares of QID at $40.26. In the video analysis, I stated I would enter in the $38-40 range, but today's open was too good to pass up.
I went short 500 shares of NOV at $69.44. This is a classic reaction back up the breakout bar. The stock closed at $66.91 and my target is in the $63-64 range.
I went short 300 shares of AAPL at $176.08 later in the day. The stock had climbed above $176 early in the day, pulled back and mounted this level in the afternoon. I went short when the bulls failed to hold the high, on the break of the morning high. The small position size reflects the fact that this stock will likely enjoy a big bounce if the market stabilizes.

Thursday, October 18, 2007
Today's Trade: NVDA
NVDA broke out over a month long trading range yesterday, making new highs on strong volume. Voume patterns suggest accumulation. I used today's weakness for entry.
I bought 400 shares at $38.52.

I bought 400 shares at $38.52.

Thursday, October 04, 2007
I just missed out on a $1400 gain! (and NOV trade)
This morning I placed a buy stop for 100 shares of BIDU at $305, using my "buy the weakness" strategy for the stock. As you can see from the chart below, the stock dipped to $306 before rocketing to $318.

Trading can be a frustrating game. I'm going to have to put this miss in the rearview mirror and focus.
I did buy 400 shares of NOV at an average price of $71.84.

Trading can be a frustrating game. I'm going to have to put this miss in the rearview mirror and focus.
I did buy 400 shares of NOV at an average price of $71.84.
Wednesday, September 26, 2007
Today's Trade: AEM
I bought 300 shares of AEM at $46.85. I've been waiting for a pullback to support in gold and it looks like we've finally got one. Stochastics have reached extremely oversold levels and obv has dipped to a support level on low volume.
There are a few reasons to be skeptical about this trade. It's always tough entering into a sector when the rest of the market is up and breadth levels are close to 2-1 to the upside. Also, today's price bar is long to the downside, which is not ideal. If volume had been extreme on this pullback, that would have been a dealbreaker. However, since volume is still lighter than the updays, I'm was willing to take a small feeler position.

There are a few reasons to be skeptical about this trade. It's always tough entering into a sector when the rest of the market is up and breadth levels are close to 2-1 to the upside. Also, today's price bar is long to the downside, which is not ideal. If volume had been extreme on this pullback, that would have been a dealbreaker. However, since volume is still lighter than the updays, I'm was willing to take a small feeler position.

Monday, September 24, 2007
Today's Trade (FWLT), Market Notes and Off-Topic
I bought 100 shares of FWLT at $129.26. This is a small feeler position and I will buy more on a pullback into the $125-126 range. To the upside, I will buy more on a break of $135. Note that this is a position trade with a longer time frame than some of my recent trades.
I am glad we finally received a day of consolidation (although many stocks I follow are still on fire, ala BHP and GRMN). Hopefully we'll get a few more days like this, which will be great for trend-pullback plays.

Off-Topic:
This weekend I received more non-trading e-mails than usual. This is probably due to the links post and the new site design.
I'm still tinkering with the site design. By the end of the week it may look completely different. I welcome e-mails and feedback on the design.
I received and appreciated all of the tv show suggestions. It looks like I'm going to have to put some new shows on my Netflix list. As for new fall shows, tonight I'm going to sample Big Bang Theory and Chuck. Of course, I can't wait for the new Heroes episode.
Great weekend for NFL QBs. A ton of 300 yard games. Patriots win the Super Bowl. Anybody want to bet against me?
I am glad we finally received a day of consolidation (although many stocks I follow are still on fire, ala BHP and GRMN). Hopefully we'll get a few more days like this, which will be great for trend-pullback plays.

Off-Topic:
This weekend I received more non-trading e-mails than usual. This is probably due to the links post and the new site design.
I'm still tinkering with the site design. By the end of the week it may look completely different. I welcome e-mails and feedback on the design.
I received and appreciated all of the tv show suggestions. It looks like I'm going to have to put some new shows on my Netflix list. As for new fall shows, tonight I'm going to sample Big Bang Theory and Chuck. Of course, I can't wait for the new Heroes episode.
Great weekend for NFL QBs. A ton of 300 yard games. Patriots win the Super Bowl. Anybody want to bet against me?
Wednesday, September 19, 2007
MT Trade
I entered MT this morning, buying 300 shares at $71.48. Stepping back from the trade, it looks like I may have entered a bit early.
The last time MT had a similar breakout with a long price bar (early June), price action immediately pulled back to the breakout point before resuming the uptrend. The same thing could happen again.
I've set my stop under the breakout point at $68 and may purchase more shares on a pullback.

I also bought 200 shares of BCSI at $85.53.
The last time MT had a similar breakout with a long price bar (early June), price action immediately pulled back to the breakout point before resuming the uptrend. The same thing could happen again.
I've set my stop under the breakout point at $68 and may purchase more shares on a pullback.

I also bought 200 shares of BCSI at $85.53.
Thursday, September 06, 2007
Today's Trades: RIMM and RS
I bought 500 shares of RIMM at $82.71. This is a short term trend-pullback play. My intitial target is the high at $85, with a stop at $81.
I covered the RS short, 500 shares at $54.05 (entry at $53.16) for a $445 loss (-1.6%).

I am still holding GMRC, SDS and LFC.
I covered the RS short, 500 shares at $54.05 (entry at $53.16) for a $445 loss (-1.6%).

I am still holding GMRC, SDS and LFC.
Wednesday, August 29, 2007
Today's Trade: FLR
I bought 500 shares of FLR at $120.20. The stock has been on my primary watchlist since the July breakout and has been a great trend pullback trade. I recently set an entry of $117-120, and the stocked dipped down to $119 yesterday. However, I decided to take a wait an see approach because of yesterdays overall market weakness and uptick in negative volume. Today's strength quashed my fears, and I was willing to buy a little above my entry range.
Along with price support, RSI is at a strong support level (50). I also like the fact that stochastics and OBV have made higher highs.
My initial target is $125, with a stop under the 50 day moving average, at $116.

Along with price support, RSI is at a strong support level (50). I also like the fact that stochastics and OBV have made higher highs.
My initial target is $125, with a stop under the 50 day moving average, at $116.

Thursday, August 23, 2007
Shorting Momentum Stocks: the GRMN Trade
Those of you familiar with my trading style know I rarely short high flying stocks. While it seems logical to go against a stock that is overextended, this type of trade generally takes on too much risk. Stocks tend to trend longer than they "should" due to market psychology and short squeezes.
However, there is one contrarian setup that I do use on momentum stocks. A stock that reaches it's high, without RSI and OBV confirming the move, gets my attention as a short play.
Take a look at the GRMN chart. During the last high, OBV and RSI levels were higher than they are now. This "negative divergence" is a sign that the stock is not ready to rocket to new highs.
A negative divergence is not enough to jump in. We also need to see a failure at the old high level. We've got that here with GRMN. The stock stopped right at $105 and has pulled back.
The last piece of the puzzle is volume. Volume patterns in this stock are not bullish. We've seen more volume on the downside than upside. This was enough to get me in as a short today.
I went short 100 shares of GRMN at $102.65.
Note that I am not making a big bet here. I took a small position and my stop is above the old high at $105.50. I am risking less than $300. It's never a good idea to make big bets against the trend.
Subscribe to:
Posts (Atom)