Showing posts with label setup. Show all posts

Friday, October 03, 2014

How to Swing Trade Late Day Strength Off An Intraday Reversal

As a swing trader it is important to understand that strength often begets more strength.  This is the central principle of the hammer setup.  We look for strength at the end that reverses what looked to be a down move earlier in the day.

$SPY is a good example of this setup.  Trade Report members were alerted to this setup as I made the trade before the market close.  Like clockwork the market gapped up today and the position was sold for a quick profit.

It is tough for some to enter a position when a significant move has already been made.  However, this is a high probability setup and one must forget about what has already happened and look to the high probability of what will happen.


If you would like to learn more about how I trade, receive my nightly focus list with market analysis, setups and trade alerts, sign up for a 7 day free trial at BullsonWallStreet.com. If you like this article, follow me on twitter

Monday, June 23, 2008

Trade Entry: TRA

I bought 500 shares of TRA at $53.12.

Setup: A combo platter of a breakout and trend-pullback and entering within a forming high and tight flag. I expect a continuation of the trend. Great volume pattern and RSI and stochastics confirm price highs. The stock is under accumulated here.

Risk: My intial target is the recent high at $60. My stop is just under the forming consolidation area.

Concerns: No doubt, the stock (and sector) is overbought. However, momentum and volume are so strong that I'm betting the trend will continue.

Wednesday, May 14, 2008

Chart Attack

Here are selected charts from my watchlist.

SRX: Breakdown-pullback with bearish flag forming.


FSLR: Momuntume breakout. Hot sector. Overbought so I'd wait for a pullback.


LEH: Weak downtrend consolidation. If it falls, lots of room to drop. Easy stop placement limits risk.


ICO: Nice Uptrend. Possible buy on low volume dip to 20 day moving average.


GXDX: Nice breakout after bottoming formation.


GG: Classic short setup. Typical of most gold stocks. Coming off overbought condtion on pullback.


DFG: Breakdown-pullback with bear flag formation. Nice short setup.

Saturday, May 10, 2008

Today's Trade: EWZ

I bought 200 shares of EWZ, the Brazil ETF, at $91.61.

Setup: Bullish Flag post Breakout-Breakout Pullback. The stock pulled back to the top of the breakout level, which is also where it broke resistance. Recent volume pattern is strong and obv has increased as stock has pulled back from breakout. As a plus, all things Brazil have been on fire.

Risk: My initial target is the old high around $95. I will either take full or partial profits at this level. If I feel the stock is ready to breakout to another new high, I'll keep a position. My stop is just under price support and the 20 day moving average, in the $88-89 range. This only gives me an intial risk of about 1:1 reward to risk, but I feel the probability of the setup is strong. Also note this is the "initial risk". If I decide to stay in for a breakout of $95, my target will be higher.

Concerns: Stochastic not yet oversold, but still is under 50. U.S market could pull down strong region like Brazil. Still, Brazil has great relative strenght compared to S&P 500.

Wednesday, February 13, 2008

5 Bullish Chart Setups

I rarely trade 100 percent long or short, even if trading within the confines of a wildly bullish or bearish market. While my market bias is bearish, there are still some bullish stocks to trade. Here are a few nice looking setups, though few are perfect.

BMRN
The stock broke out in December and has traded in a consolidation range ever since. It looks a bit extended here. I'd like to buy on a pullback to the 50 day moving average.


KWK
Price action has been good, but the volume pattern does concern me. The current price breakout has not moved on tremendous volume. Many independent oil and gas stocks are showing similar patterns.


MTL
Unlike KWK, MTL's volume pattern is confirming the price move. This one's at the top of my watchlist.


CF
I am not as bullish on the ag stocks as some. CF has one of the best charts among the grouping, but still has some concerns. Namely (surprise, surprise), the volume pattern is not confirming the up move. I'd like to see CF break out to new highs on very strong volume before entering.


WMS
Fantastic chart. Price breakout confirmed by accumulation pattern in volume. The stock is extended. I'd like to buy on pullback to support.

Friday, February 08, 2008

MA's Bullish Pullback

Mastercard, MA, has pulled back to the breakout point and shows a solid accumulation pattern post breakout. It is a bit concerning that the stock pulled back so quickly, but it did come on lower volume and is holding support.

Concerns aside, the stock does offer a well defined reward to risk setup. If entering at the current price ($205), a logical stop would be under the 50 day moving average with the target at the recent high of $220. That would give a 3:1 reward to risk ratio.

Tuesday, July 10, 2007

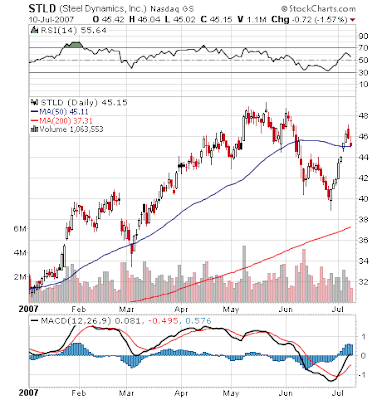
Chinks in the Armor: STLD

STLD and other steel stocks have been momentum favorites of mine for quite some time. While many steel stocks still look solid (l MT and RIO to name a few), some noteworthy high flyers are showing chinks in the armor. This is not a good sign for the industry as a whole.

Let's take a look at STLD's chart. The first thing that jumps out at me is that RSI is making lower highs. It is noteworthy that while price was making a double top that reached the old high in May, RSI trended lower.

Some may look at the recent positive price action and conclude that STLD is on it's way back to it's old highs. While the fact that the stock jumped back over the 50 day moving average and breakdown point earlier this month may seem like a bullish signal, it did so on less volume than the downtrend. Volume is the engine that pushes a stock forward, and I don't see much of it here. Therefore, the stock is front and center on my watchlist.

Note that this analysis is not a prediction that the stock will not mount it's old highs. However, it's fair to say that the probabilities favor a down move. While I won't take a stake in either direction just yet (that would be gambling, IMO), I will watch for a breakdown of support.

The key level to watch is $44. This area has acted as support since April, breaking down only once and subsequently remounting that level. If we see a high volume breakdown below $44, I will likely go short.

Thursday, July 05, 2007

Google Forming a Negative Divergence

While GOOGLE (GOOG) made my long position trading watchlist (entry at 50 day moving average), I could not help but notice the startling RSI, OBV and stochastic divergences that have formed at the current new highs.

For those who don't know, a negative divergence forms when price increases while the indicators decrease. As you can see from the chart below, that is precisely what is happening to Google.

While it is tempting to short a stock at the moment a divergence is spotted, only aggressive traders willing to take on high risk or use a very tight stop should go short now. The more prudent way to play this divergence is to wait for the stock to break below the old high before going short. Here we would short on a break below $535, with a stop above the old high and a target near the 50 day moving average, approximately $520.

While the stock is on my very short term "short" watchlist, it is also on my longer term postion trading "long" watchlist. I would enter long on a pullback to the 50 day moving average. In an ideal world, I'd be able to short down to the moving average, then reverse and go long.

Tuesday, June 26, 2007

Market Technicals

The S&P 500 is at a critcal juncture, already having broken below the 50 day moving average and now ready to test recent lows. If we see a breakdown below 1487, we officially will be in a short to mid term downtrend. A violation of this level would also signal a double top short setup. Thomas Bulkowski has a good primer on the double top short setup.

It may be time to start beefing up the short watchlist.


Thursday, June 07, 2007

ILMN Revisited and a Video Question

Two nights ago, I mentioned ILMN as a "short float" breakout candidate. The stock had broke out over resistance and had a low float coupled with high short interest. These conditions lead me to believe we could be setting up for a parabolic move higher. Take a look at how it's stock has performed over the past two days.

The stock is consolidating it's breakout, but has not fallen with the market. Considering the carnage over the past two days, that's quite admirably. I wouldn't be surprised if it makes a big move in the coming week.

I have a "mental buy stop" placed just above the 200 day moving average.

Video Question:
I would like to start posting video of my daily chart and watchlist reviews, but I don't know where to begin. Is it as simple as pointing a webcam towards the computer screen, or is there some type of software I should use? Any help would be appreciated. Please leave a comment or email me at SinghJD1@aol.com with any suggestions. Thanks.

Wednesday, June 06, 2007

"Short Float" Breakout Setup: ILMN

ILMN made a 4 % gain today over established resistance. However, that's not what put it on my watchlist. Stocks in a downtrend do not usually make the cut. What makes this stock special is that it is a low float stock with a high short interest ratio.

The stock's float is a little over 5 million. To put this in perspective, AMZN and HTZ both have over 30 million floats. What this tells you is, if there is strong buying interest, it will be easy for ILMN to make a parabolic move.

The short interest ratio is 12.6 percent. That puts it's short interest in top 10 percent of today's top 40 breakout stocks. Not bad. If there is buying interest and price starts to move up, there is a good probability that we will see some short covering. This could make what would have been a small gain after the breakout into a parabolic move.

Ideally, I like to use this setup for stocks that are not in a downtrend. For example, take a look at IOC. This one was a perfect setup, but now is a little too far from it's breakout point. However, it works for stocks that are reversing from downtrends as well, you just must play it more cautiously.

To sum it up, here is what I like about ILMN:

A. Short Interest High
B. Float Low
C. Breakout
D. Over Resistance

Note that their are a few resistance points to cross, with the 200 day moving average at $35.81 and the gap down at 38-40. I will not enter unless the 200 day moving average is crossed, or we get a low volume pullback to the breakout point. In either case, I will use a tight stop upon entry. I tend to play it "tighter" when a stock is trying to break a downtrend.


Tuesday, May 22, 2007

Today's Trades and Analysis: GMRK and DXPE

I sold 400 shares of GMRK at $53.85 (entry at $49.76) for a $1636 gain (+8.2%).


I sold 500 shares of DXPE at $52.35 (entry at $47.40) for a $2475 gain (+10.4%).


Self Analysis:
These trades are good examples of how I have grown as a trader. Last year, I would have most likely taken profits before my profit target, which was just under the recent high in both cases. Instead, I sent my targets right after I took my positions and fought the temptation to micro-manage the trades. The result was a combined +18.6% gain, rather than what would have likely been an 8-10% gain.

Trade Analysis:
Without going into too much detail, both of these trades offered nice breakout-pullback setups. I entered at support, which was at the bottom of the breakouts, just under price congestion.

While I am not very precise with entries, I am becoming much more focused on exits. Here, I timed my exits just under the recent highs, where there would likely be some panicked traders who bought the stocks at the high and watched it pullback.

As you can see from both of today's charts, that is exactly what happened. The stocks dipped right after hitting my profit targets.

After I have taken profits at the highs, I do not dump the stock off of my watchlists. If the stock bases and then breaks out above the old high, I may re-enter on the breakout, or allow the stock back on the breakout-pullback watchlist, in hopes for a pullback to what now is the old high.

I am still holding STLD, ZUES, SYNL and IBN

Tuesday, May 01, 2007

Tuesday's Watchlist

GROW: bullish engulfing
JSDA: strong at support
SIGM: Short on pullback to gap point
ADM: $39.75 breakout earnings play
BWLD: $67.50 bo earnings play
OII: $48.50 bo earnings play
UPL: $58 bo earnings play
UA: $51 bo earnings play
VLO: pb to moving average


Monday, April 30, 2007

Today's Trade: AAPL and ADM

I bought 200 shares of AAPL at $100.25. I went over the chart on Friday.

ADM (Archer Daniels Midland Co.) reports earnings tomorrow. I will likely place a buystop at $39.75-40.10, depending on how the stock looks at the close today. If the stock clears this level (which is an intermediate term high and about a point away from where the stock is now), it will mean traders liked earnings and this level will probably become support.

Friday, April 20, 2007

Breakout Chart: XOM

Exxon Mobil Corp. (XOM) broke out to new highs on above average volume. A low volume pullback to the prior highs, just under $79, would normally provide a good entry point.

While the breakout is bullish, there are some concerns for this stock. Notice the negative divergences in both RSI and stochastics. One would expect new highs in RSI and stochastics when price hits new highs, but here the two indicators are trending down. While this is not bullish, I would not short until confirmation of the divergence. If price pulls back below the old high, we might see a quick short opportunity.

Playing armchair quarterback, it's easy to see a missed opportunity for entry at $76. Here we had atextbook breakout from a "W" bottom formation.

Thursday, April 19, 2007

Breakout-Pullback Charts: BA and AMZN

BA and AMZN look to be setting up for breakout-pullback plays. Here is a quick summary of what I like to see on the breakout:
  1. Price breaks out over established resistance on above average volume

  2. Stock closes near the high of the day, printing a long range bar

  3. Evidence of accumulation prior to breakout

  4. RSI is at a higher level than when at previous high

  5. Stochastics printing higher lows previous to breakout

Both stocks fit the breakout critieria. All that is left is a low volume pullback to the breakout point. I'd like to enter Amazon around $44 and Boeing at $92.


Friday, April 13, 2007

Today's Trades: HES, VDSI and AAPL

I sold 300 shares of HES at $57.55 (entry at $55.91) for a $492 gain (+2.9%).

I bought 200 shares AAPL at $$91.05. I had been looking to see how AAPL would handle a pullback to the peak of the double bottom formation it recently broke out from. The hammer that printed today is a strong sign that the stock will bounce here. I bought on the move up after touching the resistance line.


I bought 500 shares of VDSI at $17.63. During it's uptrend, the stock has rewarded pullback entries, especially on tests of the 50 day moving average. Yesterday's long tailed hammer looks to have been another successful test. Also note that stochastics are turning up and volume shows increased accumulation since the February breakout. These are all strong momentum signs.


I am still holding TZOO, QID and GROW.

Monday, April 09, 2007

Deja Vu

EWO, an Austrian ETF, is looking eerily similar to the way it looked at this time last year.

The stock had broke out of a base in late '05, pulled back to the breakout point, and made a move in early '06 that measured 6 points from breakout. A negative RSI divergence formed and the stock took a nose dive over the summer.

The stock recovered at support in late '06, forming the same pattern we saw last year: A breakout in late '06 accompanied by a pullback to support, followed by a parabolic 6 point rise. We even have the the same RSI divergence.

Here's another doozy. Just as last time, we are around 3 points away from the 50 day moving average.

I will likely enter a short position if we see more strength in EWO. However, I will not trade the stock in the short term account I use for this blog. Shorter term, we still could see some upside. Any entry will be a position trade (I have a separate account for my intermediate term position trades) which I may hold for a few months, with a wider stop and target.

Potential Breakout-Pullback Candidate

JAH (Jarden Corp.) has most of the characteristics I look for in a breakout-pullback stock:
  1. Price breaks out over established resistance on above average volume
  2. Stock closes near the high of the day, printing a long range bar
  3. Evidence of accumulation prior to breakout
  4. RSI is at a higher level than when at previous high
  5. Stochastics printing higher lows previous to breakout

All that is remaining for entry is a low volume pullback to support.


JAH

Thursday, April 05, 2007

Trade Review: HOC

Before posting my review of the HOC trade, I'd like to answer a question posed to me after the latest "today's trades" post. The question:

You seem to hold on to positions for only a few days even though it may seem as though the position could move higher. why is that?

The person who asked this question is quite perceptive. While I've been on a tear of late, in terms of win rate and profits, I am still frustrated because I know I should be making more money. I have been exiting trades way too early, bagging profits when I probably should stay in a little longer.

The HOC trade is a good example. When I entered the trade, at $57.94, I posted a target of $62. While I didn't say it, that target was only for partial profits. My strategy was to then move my stop up and see if the stock could breakout over new highs, which I think is likely. Using this strategy, if it breaks out, I continue to make money. If it doesn't, that's fine. I break even on the remaining shares and still have my initial profit.

Instead, I was short sighted, looked at the nice looking profit that I would gain on all of the shares, and let greed and fear based emotions get the best of me. Looking at the chart below, you will see that the stochastic level has not given a sell signal. At the least I should have stayed in the trade with half the original position.

Note that I believe I made a mistake, even if the stock tanks tomorrow. It's about doing the right thing, not stroking the ego from one trade. If I trade properly, over time what should happen will happen more frequently than not.

Setup:
Low volume pullback to support of a trending stock in a hot sector. Early entry. The safe play would have been to enter on a confirmation move a day later. However, the stock was acting perfectly and a low risk stop was in place, making for a nice reward to risk ratio.

Results:
Entered at $57.94
Exit at $60.76
$1410 gain (+4.9%)
Hold time 2 days

Final Analysis:
Great entry off of a great setup. However, I should have stuck to the plan and taken partial, rather than full, profits. This would have given me the chance to catch a big move. The fact that volume was acting nicely and stochastics are not oversold make the timing of the exit awful. I should have held on longer.

What to Work On:
A. Sticking with the plan at entry
B. Psychological aspects of profit taking.
C. Exits: partial vs full profits.
D. Exits: pay attention to stochastic indicator

What to Continue:
A. The "low volume pullback to support of momentum stocks" setup
B. Early entries on good setups with good reward to risk