Showing posts with label short. Show all posts

Monday, January 05, 2009

Oil Trade Exits

I exited both of my oil trades today for nice gains. Whereas my entries were based on an extremely oversold oil market, today's exits were based on overbought readings. Price is nearing resistance levels while stochastics are nearing extreme levels.

More strength would provide a good short entry.

Wednesday, July 02, 2008

Trade: WYNN Short

I went short WYNN today at $85.03. I only took a small position because I could a move up to the 20 day moving average. I would likely take a full position at that level.

Wednesday, February 06, 2008

Today's Trade Entries: DUG and AGU

I bought 200 shares of DUG at $46.56. DUG is an ETF that is short oil and gas. Looking at the chart, we see major accumulation and a pullback to a major moving average and price support. Note that this is the opposite of what is happening in the oil service complex. What we are really seeing is major distribution and a weak bounce to resistance levels.


I went short 200 shares of AGU at $62.16. My analysis tells me that many of the agriculture, chemical and farming stocks look toppish right now. I am already short MON, and have added AGU as a short. We've got all the classic signails: topping price pattern, break of support and heavy volume distribution.

Note that shorting this sector is not for the faint of heart. Many still think the sector has legs, and will try to get in on dips. They will likely get burned, but we still could see some bounces. When shorting a momo sector as it looks to be topping, you must manage risk and set logical stop losses.

Tuesday, January 08, 2008

Broken Momentum Stocks

It is inevitable that most momentum stocks will fall just as far as they climbed. Many investors and traders end up losing most or all of their profits either holding on or continually playing the bounces in these stocks. Here are 9 recent momentum plays that are showing signs that their incredible runs are over:

Wednesday, December 26, 2007

Today's Trades: POT and GS

I bought 200 POT at $138.14. Nice cup and handle breakout. I would have liked to enter in the $135-136 range, but I don't want to chance missing out if the year end rally continues.

I went short 100 shares of GS at $213.78. My stop is above the 50 day moving average, around $225. I would take partial profits at $200.

Tuesday, December 18, 2007

Quick Trade Update

I took small long positions in CF (92.05), AAPL (179.80), FSLR ($235.25) and RIG (132). The first three were so oversold that I decided to buy after they started to bounce off their lows. If we get the holiday bounce everybody is waiting for, these stocks should do quite well.

I used strength to short dryshippers DRYS ($77.13) and EXM (33.75). Both still could move a little higher (in fact, both closed above my short entry), however, the bounce was too good to pass up. They have very "toppy" looking formations.

I can see DRYS testing the 200 day moving average at 60. I am using a loose stop (83). If it breaks above 83, we may see a run to the 50 day moving average at $100 before resuming the downtrend. I don't mind taking the risk of loss considering the possible gain. If I get stopped out at $83, you can bet I'll try again at $100.

I took profits in shorts QID and AKAM.

Sunday, November 25, 2007

Focus List Video: QID

At the top of my focus list is QID, which is an ETF that is a leveraged Nasdaq short. Take a look at today's video to see how I plan to trade it.


http://revver.com/watch/498261/flv/affiliate/93676/qid-stock-trade-setup-11-25-07/

Wednesday, November 14, 2007

Trade Notes

I exited DCO at 42 (entry at$38.10) for a $1170 gain (+10.1%) . The setup was an earnings breakout-pullback. I will re-enter on a pullback to $40.

I exited 200 shares of NOV at $67.35 (entry at $63.74) for a $722 gain (+5.7%) . This was an oversold bounce play that now looks like a good deat cat bounce short. I may short it later today.

I exited OII at $67.04 (entry at $62.50) for a $908 gain (+7.5%). Same setup as NOV.

I covered my VMW short at $94.46 (short at $89.10) for a 1072 loss (-6.1%). I still like this as a short. Volume on upmove is low. It's just bouncing more than I expected.

I am short another 200 shares of QID at $38.75.

I am short another 200 shares of TOL at $22.44.

Sunday, October 28, 2007

Short Candidate: Honeywell

Due to the fact that we have been in a solid uptrend, I haven't pointed out many short candidates over the past few months. While the market is currently in a state of flux, I am still hesitant to fire off a big batch of shorts since we are still in an uptrend. Although there has been some recent high volume weakness and distribution days, the trend doesn't change until major support levels have broke on high volume. That has not happened yet.

If you plan to go short this market, make sure to do so with extreme care and risk aversion. With that said, here is a stock on my primary short watchlist. I am not sure if I'll pull the trigger.

Tuesday, October 09, 2007

6 Stock to Buy on a Dip

The market is now in extremely overbought territory, which is why I actually deployed a short today (DHI- a housing stock at the top of it's downward trend channel). It's seems like ages since I've shorted a stock, and believe it or not, I love shorting!

Along with my primary long watchlist, which consists of weaker support levels that are close to current price, I'm making a list of stocks to buy on deeper dips to stronger support levels.

Six stocks on this list (with entry points) include VDSI (36), CPLA (57), VIP (26), PCU (115), AAPL (150) and BRCM (37).

Wednesday, August 22, 2007

SGR Lookin' Like a Dead Cat

Shaw Group Inc. (SGR) is a former high flying stock that seems to have lost its mojo. In July, the stock gapped up after a long uptrend, but could not hold the gap level. It now looks like the gap was an "exhaustion gap", which usually comes at the end of an uptrend and signals a downswing.

SGR is in the midst of what could be a "dead cat bounce." As a short play, I like the fact that the bounce towards the 50 day moving average has been on low volume. Take a look at the recent volume pattern I highlighted on the chart; lots of high volume down days sprinkled with a few low volume up days. This is a bearish volume pattern.

This is a great short play that I wish I had entered at the close today. If I see price strength on weak volume, I will likely give it a go tomorrow (as long as price does not cross the 50 day moving average without moving back down).

Thursday, August 16, 2007

Distribution is Taking Over

Lately I have advised that market the volatility is just noise within a range and it is too early to make predictions in either direction. Things are becoming clearer now, and the news is not good for bulls.

The SPY (S&P 500 ETF) has broke down below both price and moving average support. What's worse, it has done so on strong volume. Distribution (selling on high volume) is taking over. It's tough to find strong stocks, even in market and momentum leaders.

I am looking for a dead cat bounce in financials, steel and housing. This would provide for ideal short entries.


I am looking for a dead cat bounce in financials, steel and housing. This would provide for ideal short entries.

Wednesday, August 15, 2007

Four Reasons to Sell Steel

The steel sector, which has been one of my favorites over the past year, has undergone a change in character that now puts it on my "short watchlist." Four elements make it an attractive short:

1. Signs of distribution, with high volume down days accompanied by low volume updays.

2. Break of the 200 day moving average, which had previously acted as a loose trendline.

3. Change in character of the stochastic indicator. During the trend, oversold levels were bought up right away, with the indicator spending little time in the bottom half of the chart. Current levels have remained oversold since late July.

4. Breakdowns in sector leaders such as MT, STLD, X and RIO.

A bounce towards the 200 day moving average may provide an opportune time to short stocks within the sector.

Sunday, July 29, 2007

Building My Watchlist

Today I had a little time to "get away" from the vacation and analyze the market. My best bet is we will see a "dead cat bounce" followed by another leg down. Of course, I could be wrong and we'll see more resilience from the bulls.

Right now I am building three sets of watchlists. The first is a short watchlist, which consists of stocks and ETFs that I want to see bounce to resistance before heading south. Second is a list of bullish stocks that have held strong during the tumble. For instance, CROX has not been hurt by the market misery. If I do decide to play the long side, I will be looking for "CROX-like" stocks. Finally, I will continue to monitor my "top 100 watchlist" and momentum leaders like AAPL, MA, RIG and BIDU. This will give me a good idea of the underlying strength (or weakness) of the market and provide some possible long and short plays.

While I may take a few nibbles, right now it's best to workout strategies and wait for the market to show it's hand. Trade smart and good luck to all of you. I welcome e-mail and comments on how you are currently handling your trading portfolio.

Tuesday, July 10, 2007

Chinks in the Armor: STLD

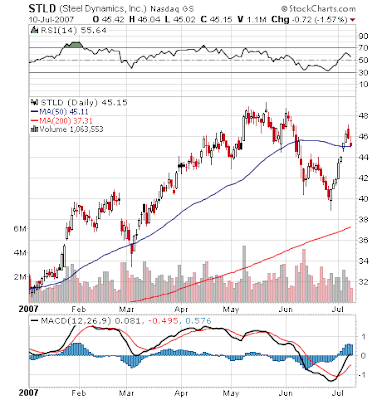
STLD and other steel stocks have been momentum favorites of mine for quite some time. While many steel stocks still look solid (l MT and RIO to name a few), some noteworthy high flyers are showing chinks in the armor. This is not a good sign for the industry as a whole.

Let's take a look at STLD's chart. The first thing that jumps out at me is that RSI is making lower highs. It is noteworthy that while price was making a double top that reached the old high in May, RSI trended lower.

Some may look at the recent positive price action and conclude that STLD is on it's way back to it's old highs. While the fact that the stock jumped back over the 50 day moving average and breakdown point earlier this month may seem like a bullish signal, it did so on less volume than the downtrend. Volume is the engine that pushes a stock forward, and I don't see much of it here. Therefore, the stock is front and center on my watchlist.

Note that this analysis is not a prediction that the stock will not mount it's old highs. However, it's fair to say that the probabilities favor a down move. While I won't take a stake in either direction just yet (that would be gambling, IMO), I will watch for a breakdown of support.

The key level to watch is $44. This area has acted as support since April, breaking down only once and subsequently remounting that level. If we see a high volume breakdown below $44, I will likely go short.
Thursday, July 05, 2007

Google Forming a Negative Divergence

While GOOGLE (GOOG) made my long position trading watchlist (entry at 50 day moving average), I could not help but notice the startling RSI, OBV and stochastic divergences that have formed at the current new highs.

For those who don't know, a negative divergence forms when price increases while the indicators decrease. As you can see from the chart below, that is precisely what is happening to Google.

While it is tempting to short a stock at the moment a divergence is spotted, only aggressive traders willing to take on high risk or use a very tight stop should go short now. The more prudent way to play this divergence is to wait for the stock to break below the old high before going short. Here we would short on a break below $535, with a stop above the old high and a target near the 50 day moving average, approximately $520.

While the stock is on my very short term "short" watchlist, it is also on my longer term postion trading "long" watchlist. I would enter long on a pullback to the 50 day moving average. In an ideal world, I'd be able to short down to the moving average, then reverse and go long.

Tuesday, June 26, 2007

Market Technicals

The S&P 500 is at a critcal juncture, already having broken below the 50 day moving average and now ready to test recent lows. If we see a breakdown below 1487, we officially will be in a short to mid term downtrend. A violation of this level would also signal a double top short setup. Thomas Bulkowski has a good primer on the double top short setup.

It may be time to start beefing up the short watchlist.


Thursday, June 07, 2007

Short Watchlist: CAL

While I'm still not in full bear mode (I won't be until the S&P breaks below 1450), I am starting to formulate a short watchlist. CAL looks like a good short on a break below $35.

Wednesday, April 25, 2007

Thinking Out Loud About Amazon

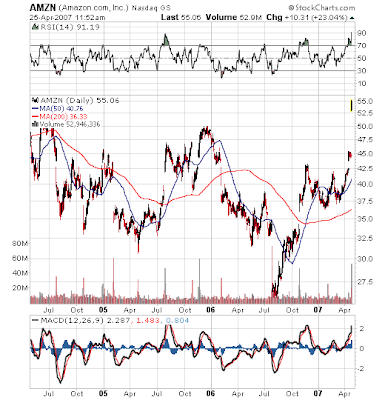
Like many, I am kicking myself for not entering AMZN yesterday. On Thursday, I featured it as a breakout-pullback candidate. When I made my trades yesterday, I came very close to taking a 500 share position at around $44.40, but decided against it for two reasons. First, I had made my buy entry closer to the the breakout, between $44.00-44.20. Second, the fact that earnings would be reported scared me. Now, I'm sitting here thinking about the $5000 I passed up :(

In all seriousness, I have no problem with passing on the trade pre-earnings. You never know how that will go. However, the fact that I held out because of 20 cents was a bonehead move. As I've noted in the past, I tend not to be very precise with entries. I am a swing trader looking for at least 1-5 point moves, so in the grand scheme of things, 20 cents doesn't mean much.

Now back to AMZN. If we look at the chart history, it looks like a high probability short setup. It's always risky shorting an uptrending breakout, but this stock has not handled extremely overbought RSI levels well. Take note of past overbought RSI levels (70-90) on the chart below. If you were willing to hold on for a little while (at least a month), you would have made a lot of money. Will this trend continue? I may take a small position (no more than 400 shares), at $55, betting that it will. I would not recommend this trade for the faint of heart, and I certainly will set a stop after entering.

I welcome reader thoughts on AMZN. Are you long or short? You can leave a comment or e-mail at SinghJD1@aol.com

Sunday, April 22, 2007

Metals and Shorts Watchlist

Here are snapshots of stocks I'm watching in the metals sector, along with some shorts:

Metals:


Shorts: